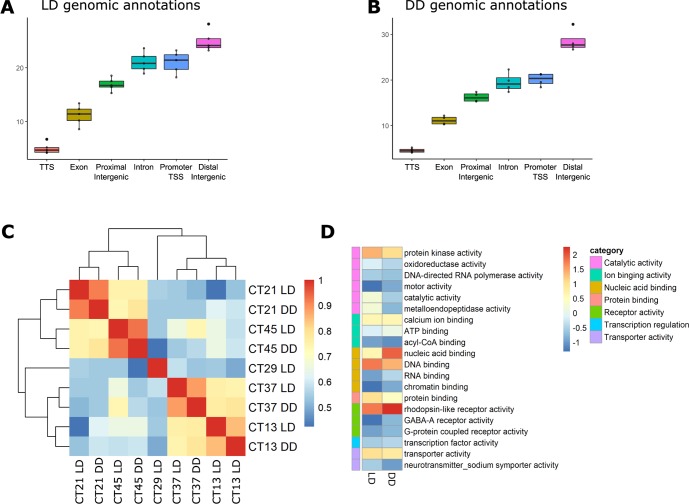
Fig 2.
(A) Boxplot representing the percentage of genomic features of LD-treated Nematostella vectensis, calculated from biological replicates across experimental sampling points (n = 5). (B) Boxplot representing the percentage of genomic features of DD-treated Nematostella vectensis calculated from biological replicates across experimental sampling points (n = 4). (C) ATAC-seq signal within consensus ATAC-seq peaks was compared between all samples, using Spearman’s ρ to cluster samples. (D) Comparison of GO annotations associated with accessible promoters identified from each library. The degree of enrichment is indicated using normalized Z-scores.

