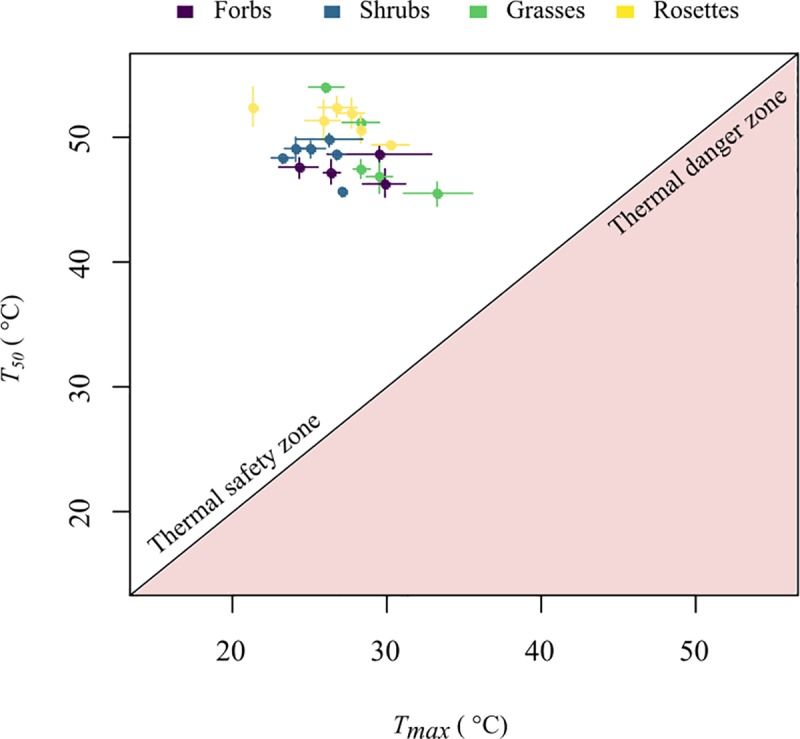
Fig 2. Visual representation of the thermal vulnerability for the 21 studied species.

The diagonal line represents the zone where heat tolerance and leaf temperature values are the same, the white zone corresponds to the thermal safety zone or where T50 is higher than the maximum daily leaf temperature (Tmax), and the pink zone is the thermal danger zone where T50 is lower than Tmax. Colors represent the species’ growth form. Lines in each point are the standard error for both T50 and Tmax.
