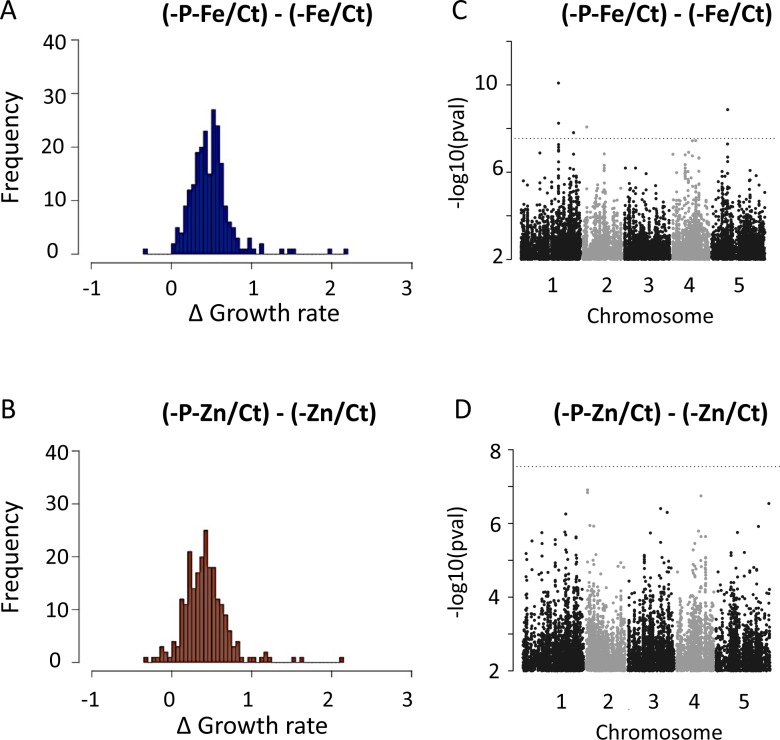
Fig 7. Compensation of root growth rate by nutrient limitation interactions and Manhattan plots of GWAS results.
(A-B) Variation in the root growth rate (RGR) between -P-Fe and -Fe compared to control condition (Ct) presented as ΔRGR(-P-Fe, -Fe) = ((-P-Fe/Ct)—RGR(-Fe/Ct)), and (B) between -P-Zn and -Zn compared to control condition (Ct)-P-Zn and–Zn presented as ΔRGR(-P-Zn, -Zn) = ((-P-Zn/Ct)—RGR(-Zn/Ct)). (C) SNPs associated with the ΔRGR(-P-Fe, -Fe) or (D) ΔRGR(-P-Zn, -Zn). SNPs are plotted according to their position along the appropriate chromosome. Plotting colors alternate between black and grey in order to facilitate the visualization of each of the five chromosomes. 5% Bonferroni threshold is indicated by black dashed line. (C-D) Genome-wide distribution of the −log10 P-values of SNP/phenotype associations using the MMA method.

