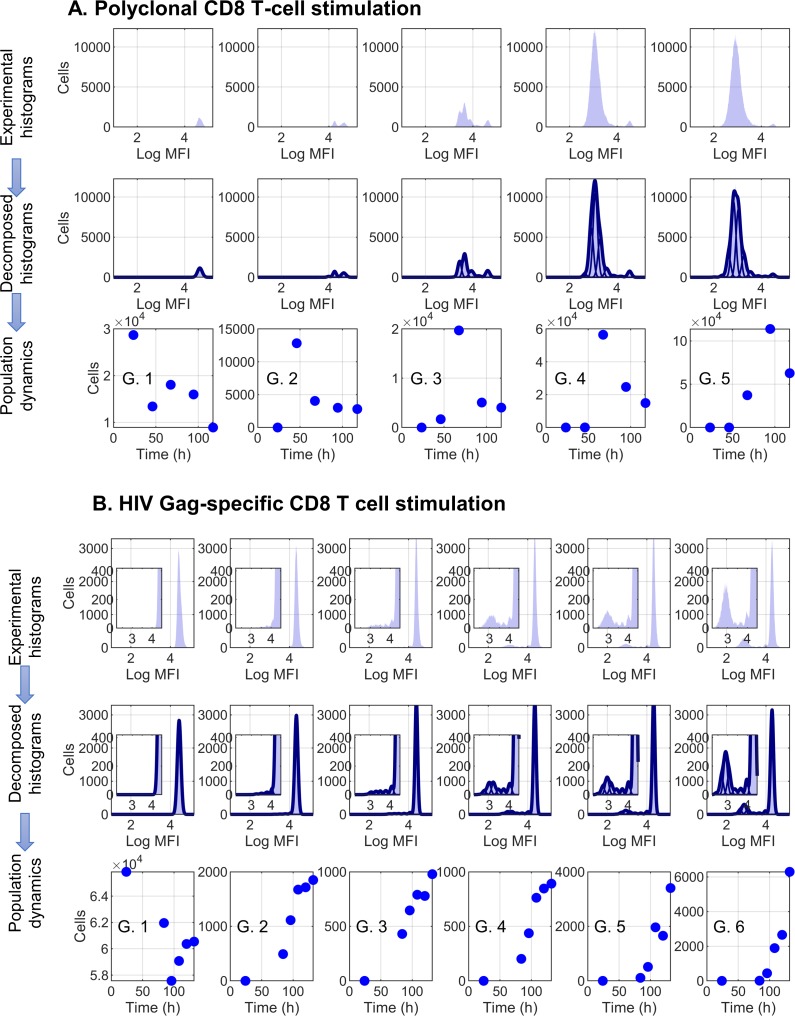
Fig 2. Mathematical analyses of CFSE-based proliferation assays.
CD8 T cells were stimulated by Phytohaemagglutinin (PHA) (A) or HIV-1 Gag peptides (B). The experimentally determined time-series CFSE histograms, decomposed histograms and the estimated cell population sizes for the different generations are shown. Histograms were approximated by the sum of gaussians, corresponding to the generations of cells. MFI, median fluorescence intensity; G, generation.

