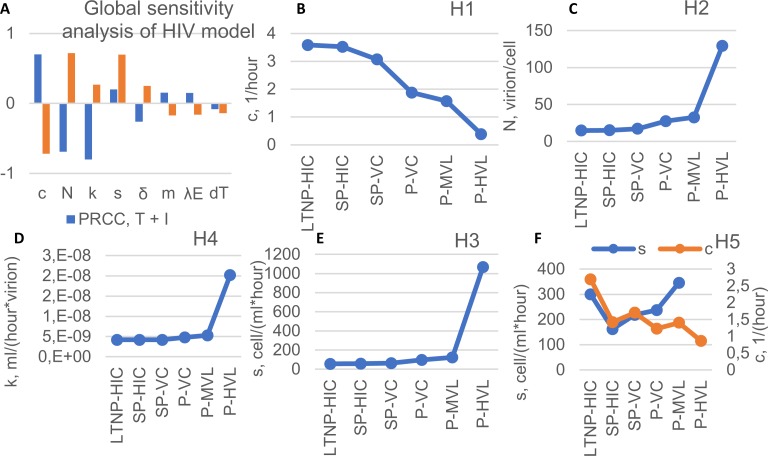
Fig 5. Global sensitivity analysis and prediction of model parameter values for the different HIV infection phenotypes.
(A) Partial rank correlation coefficients (PRCC) for the total number of CD4 T cells (T+ I) and viral load (V) in an HIV infection. Parameters are sorted in descending order according to the PRCC value. Parameters with higher PRCC values (c, N, s, k) make a greater contribution to the change of viral load and CD4 T cells. (B-F) Parameter values were estimated for different HIV infection phenotypes according to hypotheses 1 to 5 (H1 to H5).

