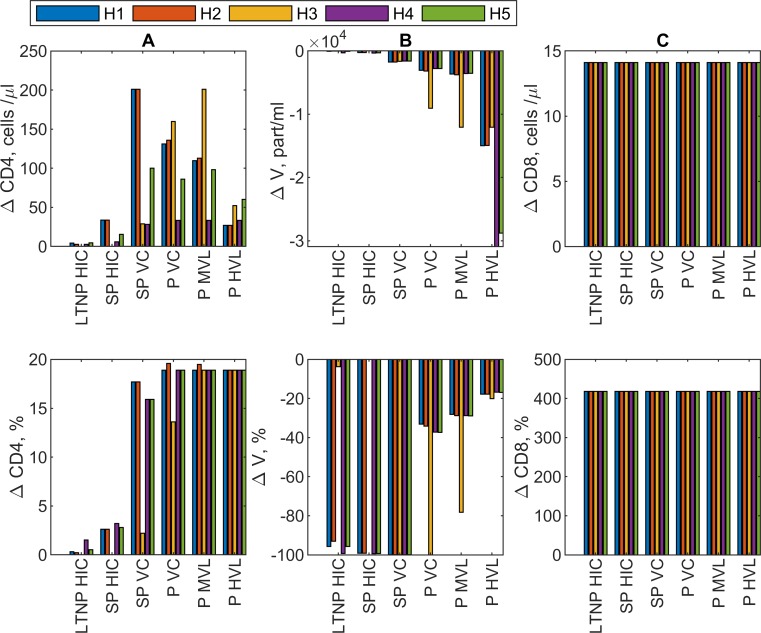
Fig 6. Prediction of the effect of PD-L1 blockade on total CD4 T cells, virus load and HIV-specific CD8 T cells for different HIV infection phenotypes under hypotheses 1 to 5.
CD8 T-lymphocyte proliferation parameters from donor HIV-156 are used as illustrative example. The predicted change in the number of CD4 T cells (A), virus load (B) and HIV-specific CD8 T cells (C) are given in an absolute (upper) or relative (lower) scale. All predictions are based on assumption 1. HIV infection phenotypes are as in Fig 1. The color code for H1 to H5 is given.

