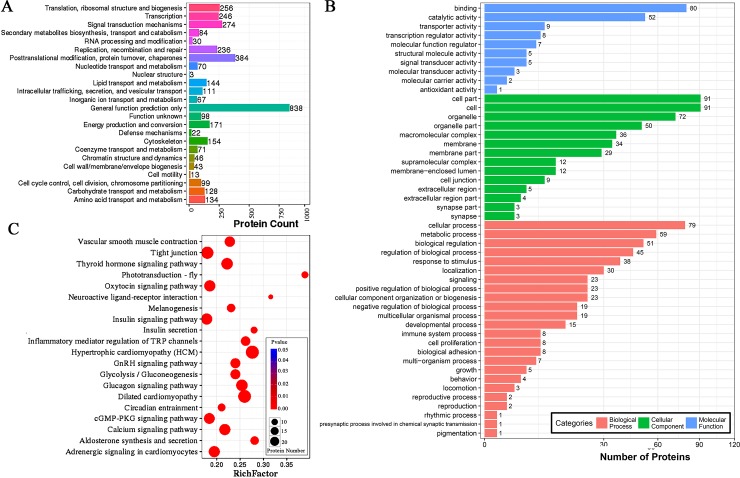
Fig 5. DEP analysis in terms of GOG, GO and KEGG.
(A) The horizontal axis represents the COG term, and the vertical axis represents the corresponding protein count illustrating the protein number of different function. (B) GO functional annotation histogram of the DEPs. The three GO categories are presented on the vertical axis under the GO term, the horizontal axis represents the gene number, and the number of genes is accounted for by differences in the proportion of the total. The GO annotations are classified in three basic categories including cellular component, biological processes, and molecular function. (C) The name of the pathway is mentioned on the vertical axis, and the pathway matching the rich factor are mentioned on the horizontal axis. The rich factor is the ratio of the number of DEPs in the pathway to the number of all annotated proteins in the pathway. After testing multiple hypotheses, Q values were completed with corrected P value in the range of 0–0.05. The enrichment was considered significant if the P-value was closer to zero.

