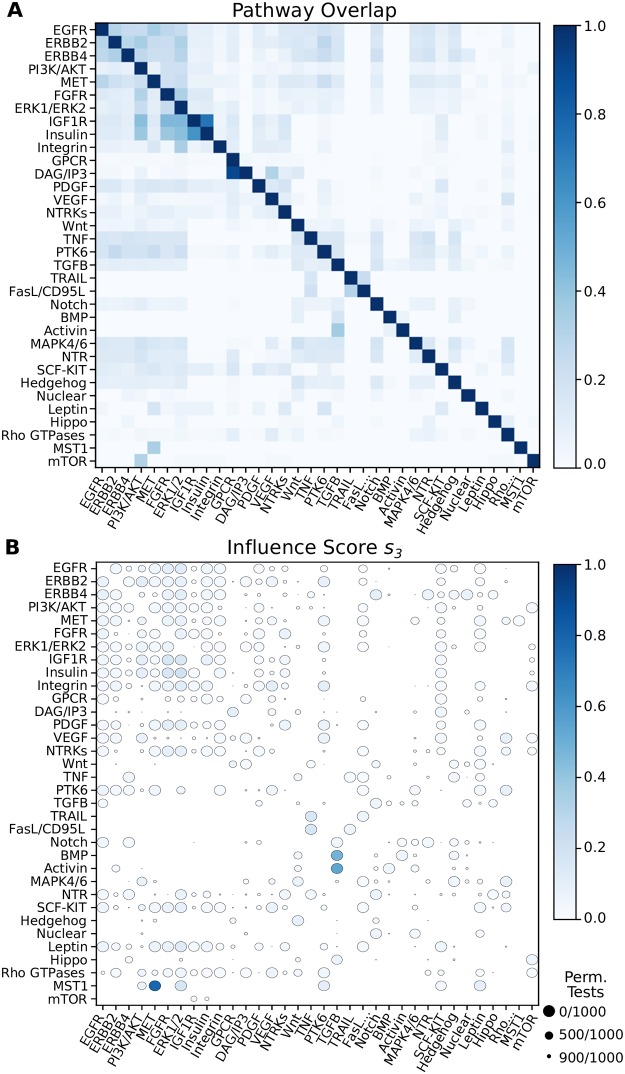
Fig 4. Overlap and influence of 34 Reactome signaling pathways.
Rows indicate the source pathway PS and columns indicate the target pathway PT. (A) Node overlap of pathway members (normalized by the size of PS). (B) Influence scores for s3. Circle size denotes the number of permutations that have scores equal to or greater than the observed influence score.

