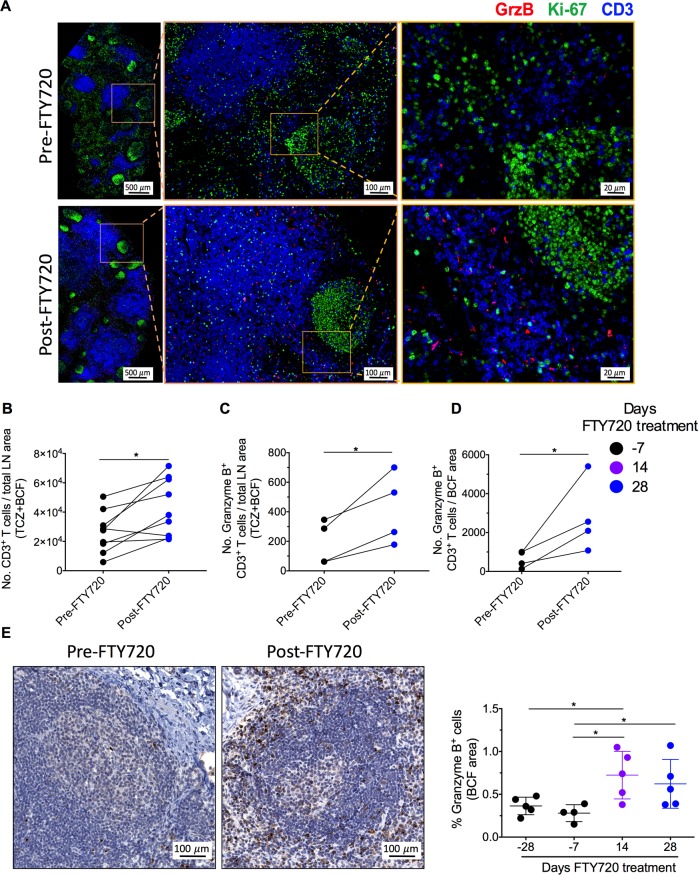
Fig 5. FTY720 accumulates T cells in LN.
(A) Representative LN section stained with the indicated antibodies and imaged by Histo-Cytometry at pre-, and post-FTY720 treatment in a high dose group animal. Scale bars: left image = 500μm; middle image = 100μm; right image = 20μm (B) Absolute numbers of CD3+ (both high and low dose groups), (C) granzyme B+ CD3+ T cells per total LN area (T cell zone and B cell follicle; TCZ+ BCF), and (D) granzyme B+ CD3+ T cells per B cell follicle area (BCF) at pre-, and post-FTY720 treatment for high dose group. (E) Representative LN section stained with granzyme B and imaged by immunohistochemistry at pre-, and post-FTY720 treatment. Scale bar = 100μm (left panel). Frequency of granzyme B+ cells in B cell follicle area (BCF) at pre-, and post-FTY720 time points (right panel) for high dose group. In (B), (C), and (D) each dot indicate data from one animal. 3–5 different sections for each animal were examined, and one representative section was choosen for final analysis. In (E, right panel) data are presented as the mean ± SD. Statistical differences were assessed with a Mann-Whitney u-test in (B), (C), (D) or (E). *P ≤ 0.05, **P ≤ 0.01, ***P ≤ 0.001, ****P ≤ 0.0001.

