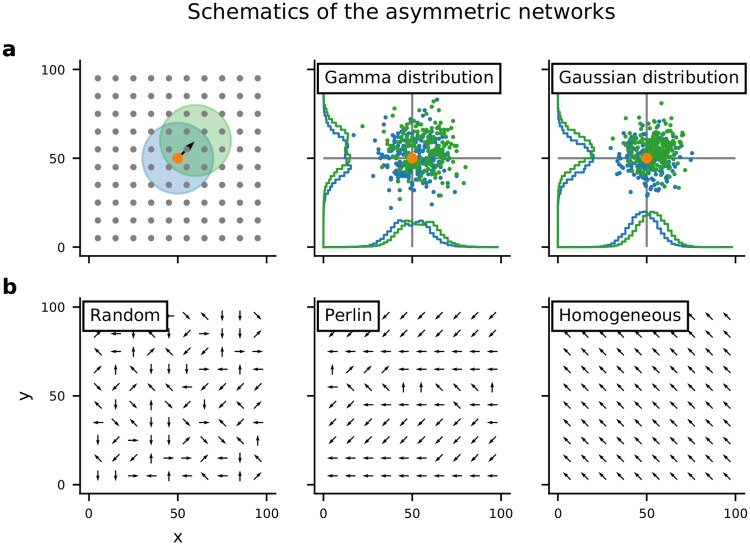
Fig 1. Schematics of the asymmetric network models.
(a:left) Neurons were arranged on a regular 2-D grid, folded to form a torus. The colored circles indicate the symmetric (blue) and asymmetric (green) spatial connectivity schemes. The pre-synaptic neuron is marked by the orange dot. (a:center) Locations of post-synaptic neurons chosen according to the asymmetric (green) or symmetric (blue) connectivity. In this case the distance-dependent connectivity profile varied non-monotonically, according to a Γ distribution. This connectivity profile was used for purely inhibitory network models. (a:right) Same as in the center panel, but here the distance-dependent connectivity profile varied monotonically according to a Gaussian distribution. This connectivity profile was used in the present study for network models with both excitatory and inhibitory neurons. (b) Schematic of spatial distribution of connection asymmetries. Each arrow shows the direction in which the neuron makes preferentially most connections (ϕ). Here we show examples for random, Perlin and homogeneous configurations.

