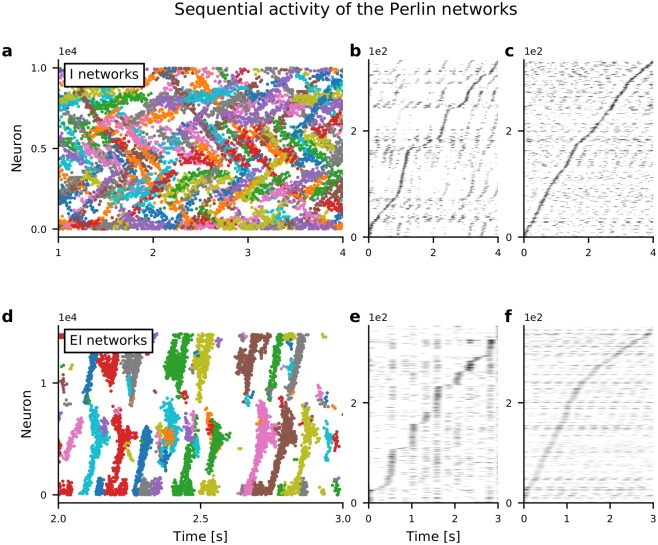
Fig 3. Spatio-temporal sequences of neuronal activity in networks with Perlin configuration.
(a) Raster plot of spiking activity in an I-network model as a function of time. Each color indicates a cluster of spiking activity in space and time, identified using DBSCAN (see Methods). Note that spikes that were not assigned to any cluster are not shown. (b) Activity of approx. 250 neurons confined in a 20 × 20 region. (c) Activity of approx. 250 neurons randomly selected from the entire network. (b, c) Selected neurons are sorted according to the time of peaked spike counts. (d, e, f) Same as in panels a, b, c, respectively, but here for an EI-network model. Note the shorter time axes in panels d, e, f, compared to panels a, b, c, indicating that sequence movement in EI-networks was clearly faster than in I-networks.

