
Fig 1. Obtaining essentiality data for 16,540 protein-coding genes in 558 cancer cell lines.
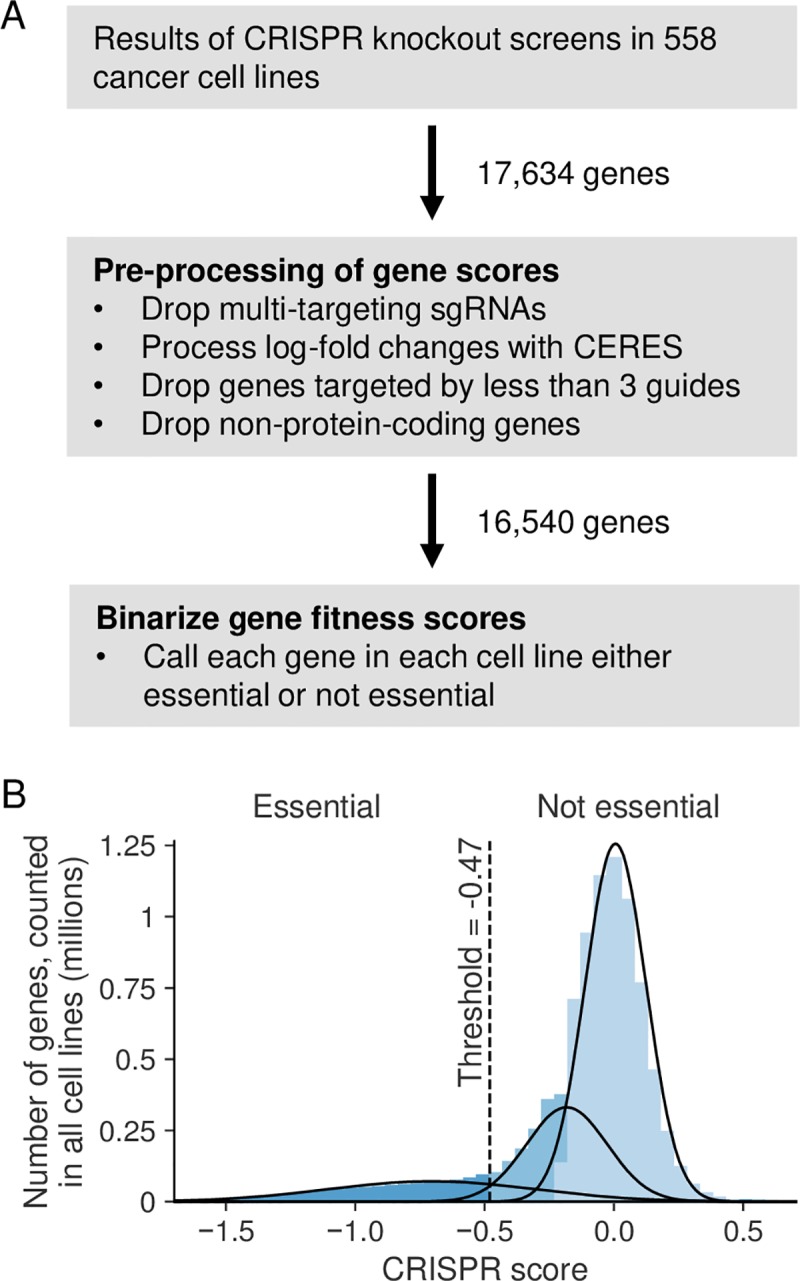
(A) Workflow showing how gene scores were pre-processed and subsequently binarized. (B) Histogram showing the distribution of all gene scores across all cell lines. Curves show the 3-components of the Gaussian mixture model fit to this distribution. Colors indicate the component model each region of the histogram was assigned to (differing shades of blue for different components). The threshold (-0.47) used to convert gene scores from continuous values to binary essential and non-essential calls is shown using the dotted line.