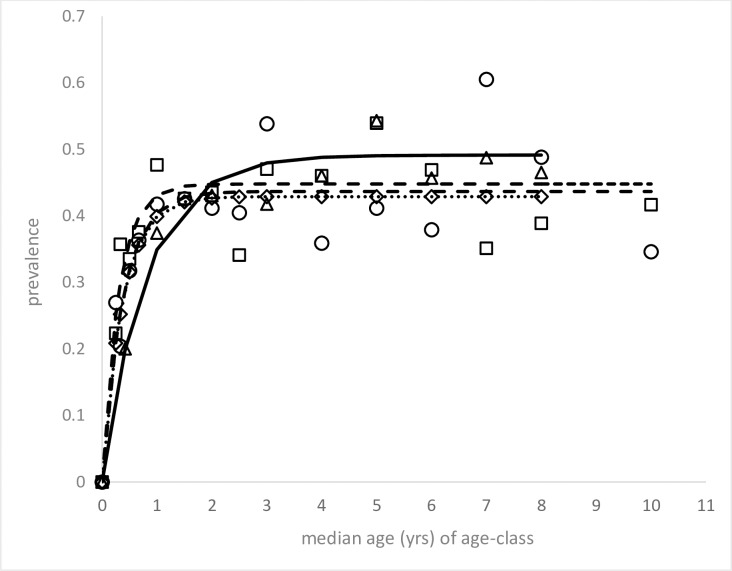
Fig 2. Canine age-seroprevalence data (symbols) fitted to an incidence-recovery model to provide the best fit (lines) from which annual FOI (incidence λ and recovery ρ) were estimated (results shown in Table 1).
Data include 4,882 resident dogs in 42 trial clusters sampled prior to recruitment, categorised here according to the intervention arm to which the clusters were subsequently randomised: pheromone (□, ----, n = 1693), collar (◇, ……, n = 1631), and control (○,- - - n = 1558) arm. Data also shown for 2,304 dogs resident in 19 towns in the same region sampled in 2006–2008 (△, solid line).

