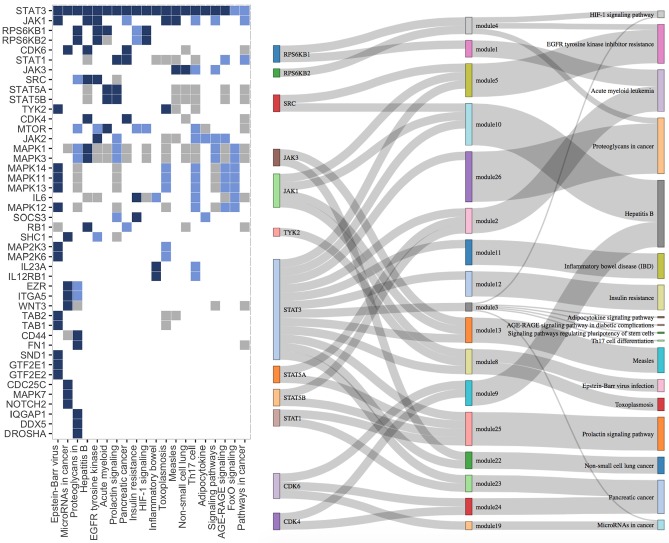
Fig 5. Visual summary of the source set analysis results for the STAT3 dataset.
(Left) KEGG pathways containing STAT3 and all genes appearing in at least one estimated source set are cross-tabulated. The color of the cell (i, j) shows the relation between the i-th gene and the j-th pathway: blue if the gene belongs to (primary source set), light blue if it belongs to (secondary set), grey if the gene is participating in the considered pathway, and white otherwise (i-th gene does not belong to j-th pathway). (Right) This plot features KEGG pathways containing STAT3 and having a non-empty estimated source set, as well as all genes appearing in at least one estimated source. The three levels are to be read from left to right. A link between left element a and right element b must be interpreted as a ⊆ b. A module is defined as a subset of a source set belonging to a connected subgraph of the associated pathway.

