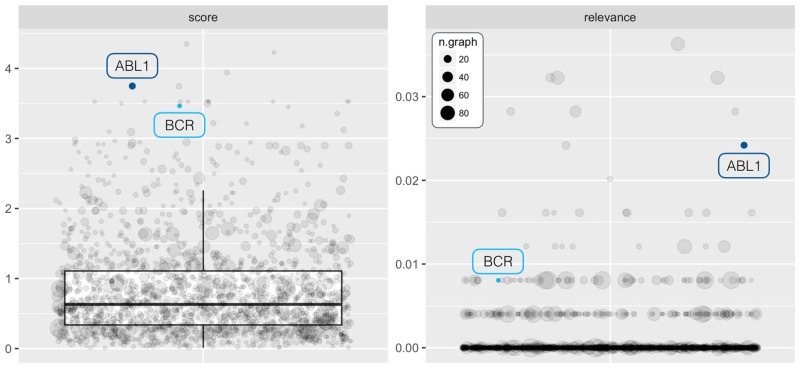
Fig 6. SourcSet analysis results for the chimera case study.
Boxplots of score (left panel) and relevance (right panel) indices for genes annotated in at least two pathways of the whole KEGG collection (N = 248). The size of each point is proportional to the number of pathways in which the associated gene is annotated. ABL1 and BCR (i.e., chimera genes) are highlighted with blue and light blue dots, respectively.

