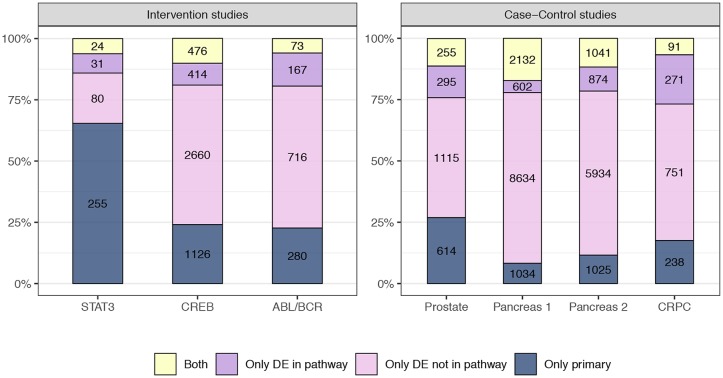
Fig 9. Visual summary of the results of differential expression and source set analysis.
Stacked bar represents the proportion of genes flagged only by the differential expression analysis annotated in at least one KEGG pathway (violet) and not annotated in any KEGG pathway (pink), the source set analysis (blue), or both, in the comparison between the two considered conditions. Genes with p-values≤0.05 are flagged as deferentially expressed (DE), and those contained in the source set estimate of at least one analyzed pathway as primary.

