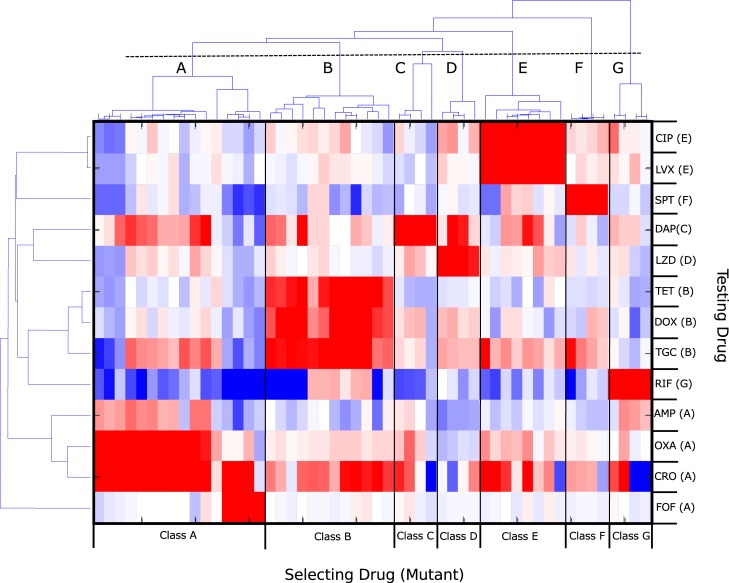
Fig 4. Hierarchical clustering of collateral sensitivity profiles partitions mutants into groups selected by known drug classes.
Heat map with ordering of rows (testing drug) and columns (four replicate experiments with the same selecting drug) determined via hierarchical clustering. Colormap and scale are identical to those used in Fig 1. Collateral profiles (columns) for mutants selected by drugs from known drug classes (here labeled A–G) cluster together; if clusters are defined using the dashed line (top), there are seven distinct clusters, each corresponding to a particular drug class: (A) cell wall synthesis inhibitors (AMP, OXA, CRO, FOF), (B) tetracyclines (TET, DOX, TGC), (C) lipopeptides (DAP), (D) oxazolidinones (LZD), (E) fluoroquinolones (CIP, LVX), (F) aminocyclitols (SPT), and (G) antimycobacterials (RIF). When clustering the testing drugs (rows), drugs from the same class are frequently but not always clustered together. For example, cell wall drugs such as AMP, OXA, and CRO form a distinct cluster that does not include FOF (bottom four rows). See also S1 Table. AMP, ampicillin; CIP, ciprofloxacin; CRO, ceftriaxone; DAP, daptomycin; DOX, doxycycline; FOF, fosfomycin; LVX, levofloxacin; LZD, linezolid; OXA, oxacillin; RIF, rifampicin; SPT, spectinomycin; TET, tetracycline; TGC, tigecycline.

