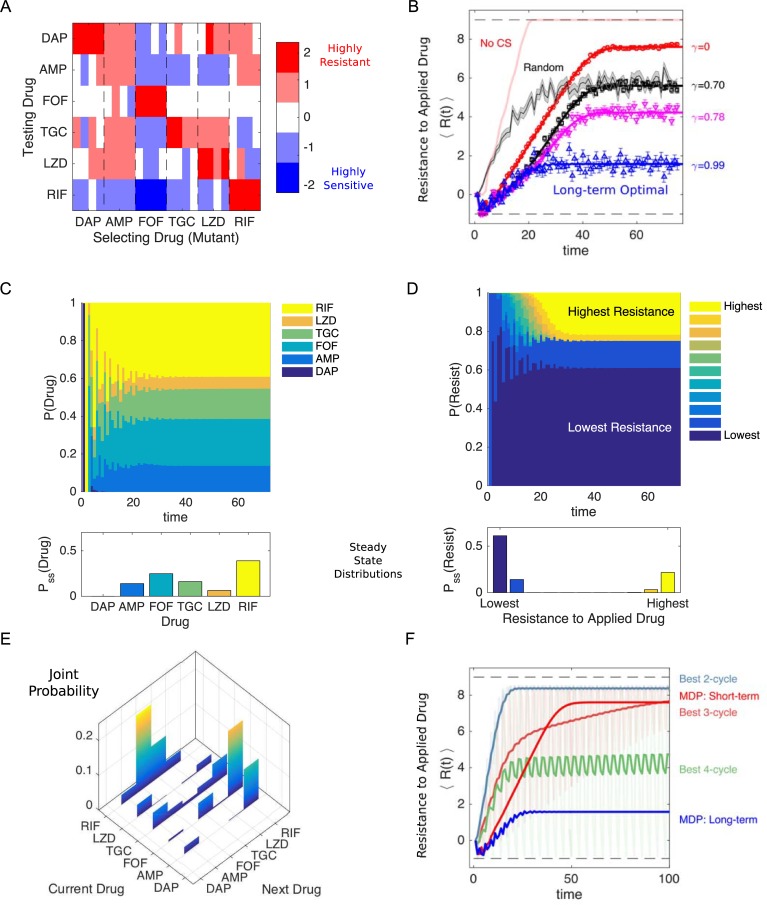
Fig 5. Simulated optimal drug sequences constrain resistance on long timescales and outperform simple collateral sensitivity cycles.
(A) Discretized collateral sensitivity or resistance Cd∈{−2,−1,0,1,2} for a selection of six drugs. For each selecting drug, the heat map shows the level of cross-resistance or sensitivity (Cd) to each testing drug (the subscript d indicates the profiles are discretized) for nr = 4 independently evolved populations. See Fig 1 for original (nondiscretized) data. (B) Average level of resistance (〈R(t)〉) to the applied drug for policies with γ = 0 (red), γ = 0.7 (black), γ = 0.78 (magenta), and γ = 0.99 (blue). Resistance to each drug is characterized by 11 discrete levels arbitrarily labeled with integer values from −1 (least resistant) to 9 (most resistant). At time 0, the population starts in the second lowest resistance level (0) for all drugs. Symbols (circles, triangles, squares) are the means of 103 independent simulations of the MDP, with error bars ± SEM. Solid lines are numerical calculations using exact Markov chain calculations (see Materials and methods). Light red line, long-term optimal policy (γ = 0.99) calculated using the data in (A) but with collateral sensitivity values set to 0. Black shaded line, randomly cycled drugs (±SEM). (C) The time-dependent probability P(Drug) of choosing each of the six drugs when the optimal policy (γ = 0.99) is used. Inset, steady-state distribution Pss (Drug). (D) The probability P(Resist) of the population exhibiting a particular level of resistance to the applied drug when the optimal policy (γ = 0.99) is used. Inset, steady-state distribution Pss (Drug). (E) Steady-state joint probability distribution P(current drug, next drug) for consecutive time steps when the optimal policy (γ = 0.99) is used. (F) Average level of resistance (〈R(t)〉) to the applied drug for collateral sensitivity cycles of 2 (dark green, LZD-RIF), 3 (pink, AMP-RIF-LZD), or 4 (dark green, AMP-RIF-TGC-LZD) drugs are compared with MDP policies with γ = 0 (short-term, red) and γ = 0.99 (long-term, blue). For visualizing the results of the collateral sensitivity cycles, which give rise to periodic behavior with large amplitude, the curves show a moving time average (window size 10 steps), but the original curves are shown transparently in the background. Data underlying this figure can be found in S1 Data. AMP, ampicillin; DAP, daptomycin; FOF, fosfomycin; LZD, linezolid; MDP, Markov decision process; RIF, rifampicin; TGC, tigecycline.

