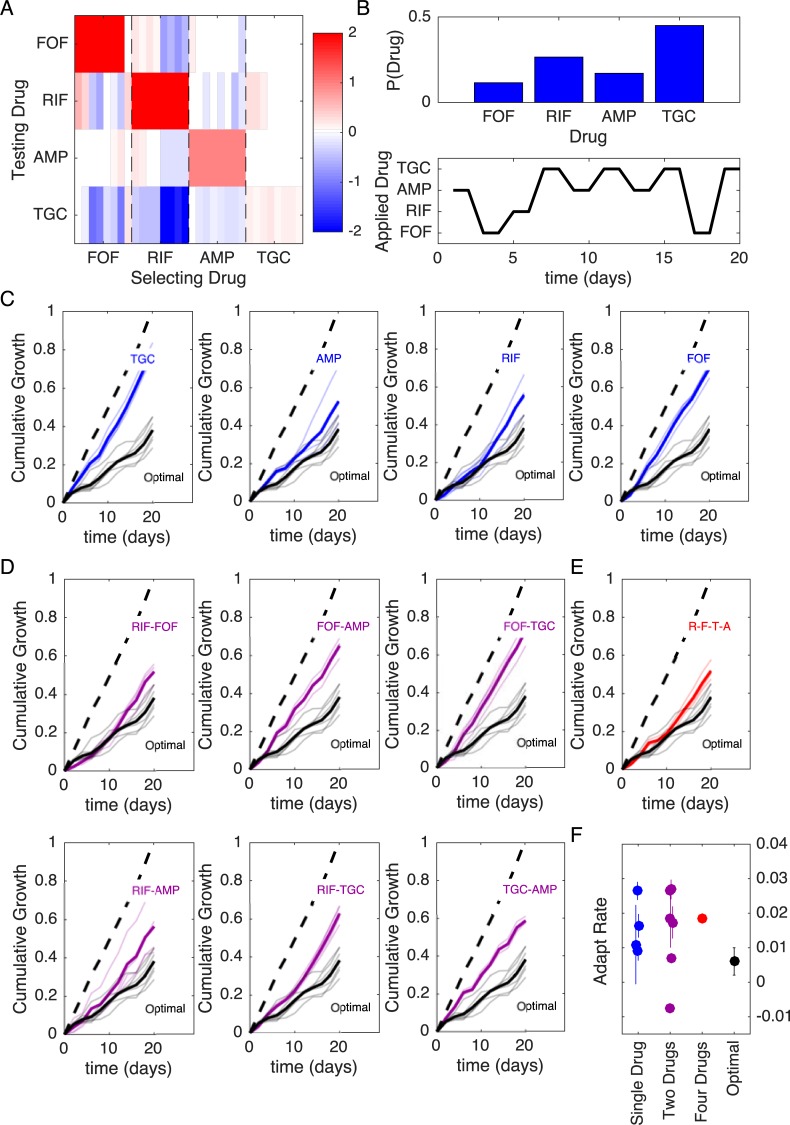
Fig 6. Optimized drug sequences reduce cumulative growth and adaptation rates in laboratory evolution experiments.
(A) Resistance (red) or sensitivity (blue) of each evolved mutant (horizontal axis; 4 drugs × 8 mutant per drug) to each drug (vertical axis) following 2 days of selection is quantified by the log2-transformed relative increase in the IC50 of the testing drug relative to that of wild-type (V583) cells. (B) Top: distribution of applied drug at time step 20 (approximate steady state) calculated over all realizations of the stochastic process using an optimal policy with γ = 0.9. Bottom: sequence of applied drug from one particular realization of the stochastic process with the optimal policy (γ = 0.9). (C–E) Cumulative population growth over time for populations exposed to single-drug sequences ([C], blue), two-drug sequences ([D], magenta), a four-drug sequence ([E], red), or the optimal sequence from panel B (black curves, all panels). Transparent lines represent individual replicate experiments and each thicker dark line corresponds to a mean over replicates. Dashed line, drug-free control (normalized to a growth of 1 at the end of the experiment). (F) Adaptation rate for single-drug (blue), two-drug (magenta), four-drug (red), and optimal sequences (black). Error bars are standard errors across replicates. Adaptation rate is defined as the slope of the best-fit linear regression describing time series of daily growth (see S15 Fig). Data underlying this figure can be found in S1 Data. AMP, ampicillin; FOF, fosfomycin; IC50, half-maximal inhibitory concentration; RIF, rifampicin; TGC, tigecycline.

