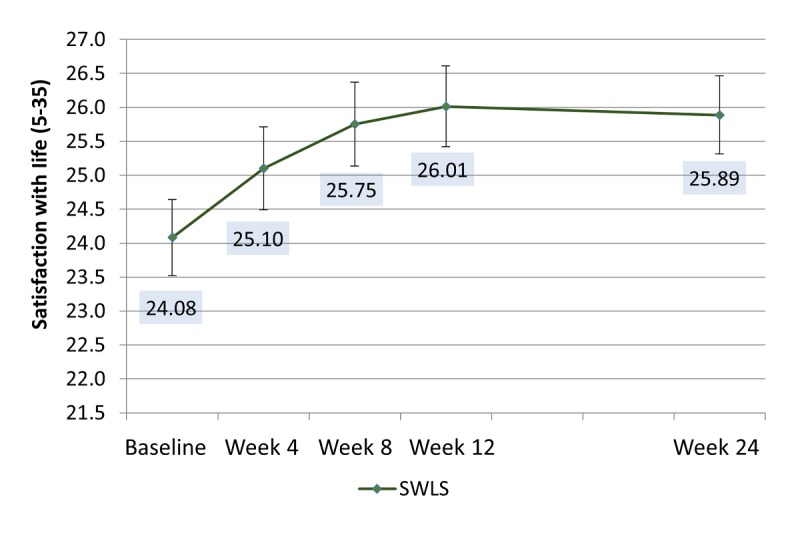
Figure 4.

Adjusted means for Satisfaction With Life Score (SWLS) over the study period pooled for both intervention groups. Significant comparisons: baseline to week 8 (P=.046); baseline to week 12 (P<.01); and baseline to week 24 (P=.01). Means adjusted for participants’ sex and age, neuroticism, self-esteem, and dispositional optimism.
