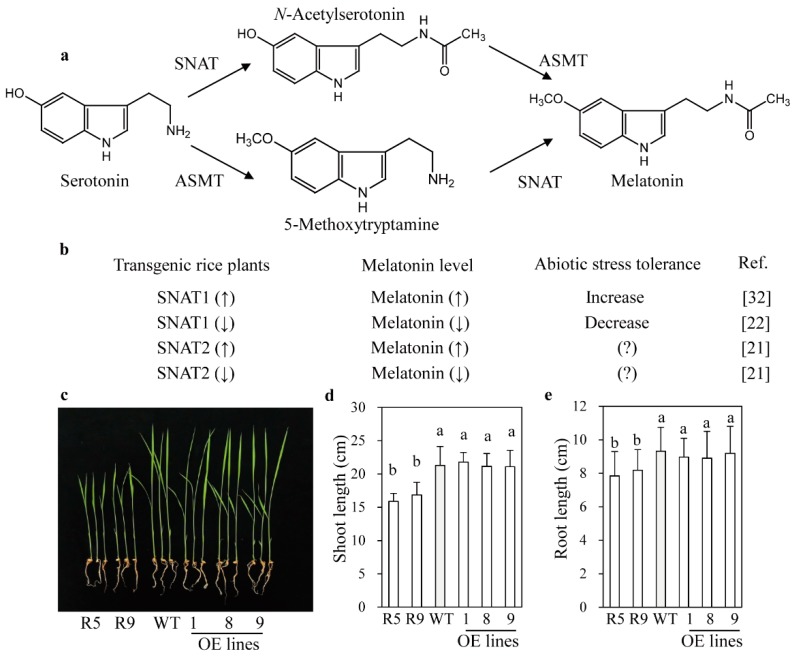
Figure 1.
Phenotypes of snat2 and SNAT2 OE rice seedlings. (a) Melatonin biosynthetic pathway in plants. (b) Relationship between SNAT gene expression and stress tolerance. (c) Seedling phenotypes. (d) Shoot length. (e) Root length. Germinated seeds were grown under a 14-h light/10-h dark cycle for 12 days. Values are means ± standard deviation from three independent experiments. Different letters indicate significant differences, as determined by a post-hoc Tukey’s honestly significant difference (HSD) test at p < 0.05. R5 and R9: SNAT2 RNAi lines; OE, SNAT2 overexpression lines; WT, wild type. ↑ denotes increase and ↓ means decrease on melatonin level. ? denotes no data available.

