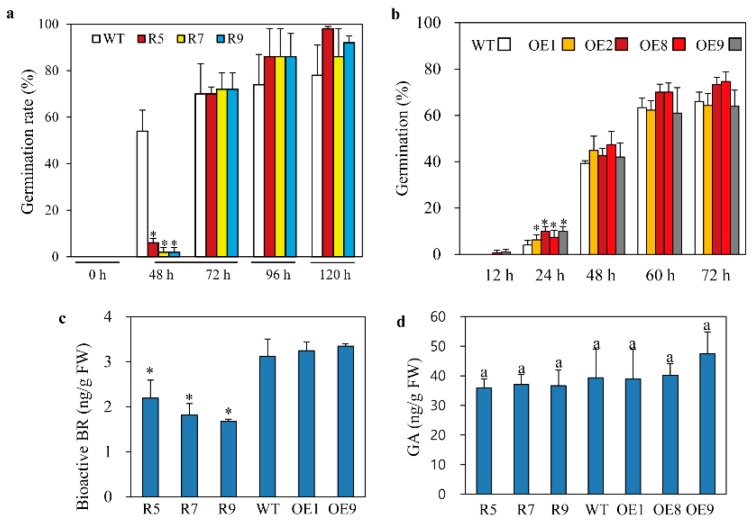
Figure 4.
Germination rates and bioactive BR and GA levels. (a) Time course of snat2 rice germination. (b) Time course of SNAT2 OE rice germination. (c) Bioactive BR levels. (d) Bioactive GA levels. Rice seeds were germinated under 14-h light/10-h dark long day conditions for the germination test. BR and GA levels were quantified by ELISA using 7-day-old rice seedlings grown in half-strength MS medium. Different letters and asterisks indicate significant differences as determined by a post-hoc Tukey’s HSD test at p < 0.05. Data represent the mean ± standard deviation of triplicate experiments.

