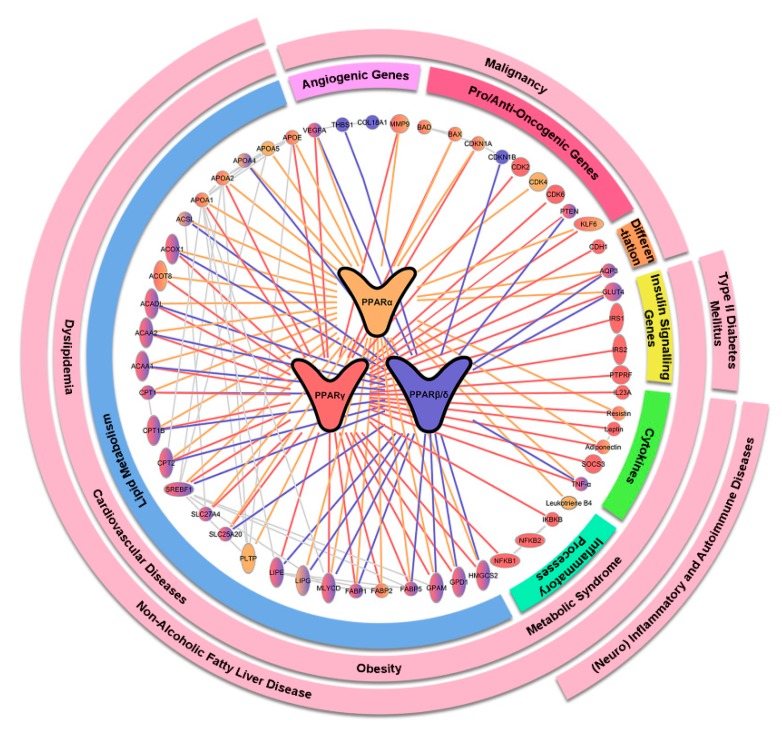
Figure 2.
Key target genes and interacting proteins of PPARα, γ, and β/δ and their downstream biological functions and implicated health conditions. Genes and proteins regulated by or interacting with PPARα, γ, and β/δ are represented by yellow, red, and blue lines, respectively. The downstream biological functions of the genes are reflected in the innermost circle while the implicated health conditions are highlighted in pink in outer circles.

