
Fig. 4. Application of effervescent MN patches to porcine skin ex vivo.
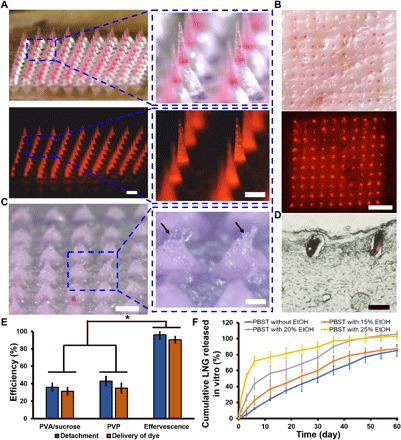
(A) Representative bright-field (above) and fluorescence (below) microscopy images of an effervescent MN patch with MNs containing red fluorescent dye (Nile red). Scale bars, 500 μm. (B) Representative bright-field (above) and fluorescence (below) microscopy images of porcine skin after MN patch insertion and MN detachment in porcine skin ex vivo. Scale bar, 2 mm. (C) Representative bright-field microscopy images of a residual patch after application to porcine skin. Black arrows indicate the dissolved PVP polymer in the backing at the sites of MN separation. Scale bars, 500 μm (left) and 200 μm (right). (D) Representative image of a histological section of porcine skin after MN patch insertion and separation of MNs imaged by bright-field microscopy. Scale bar, 200 μm. (E) Quantification of the efficiency of MN detachment and delivery of Nile red dye from MN patches with effervescent backing, PVA/sucrose backing, and PVP backing. Each point represents mean ± SD (n = 5), *P < 0.05. (F) Cumulative LNG release in vitro from LNG-loaded MN patches in PBST solution containing ethanol at different concentrations at 37°C, shown as a function of time. Each point represents mean ± SD (n = 3).