
Fig. 5. LNG pharmacokinetics from effervescent MN patches in vivo.
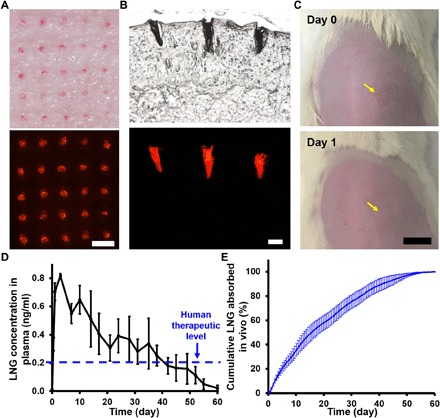
(A) Representative images of rat skin in vivo after MN patch application and removal showing MNs embedded in the skin by bright-field (top) and fluorescence (bottom) microscopy. Scale bar, 500 μm. (B) Representative histological section of rat skin imaged by bright-field (top) and fluorescence (bottom) microscopy, showing MNs embedded in skin after application of effervescent MN patch in vivo. Scale bar, 200 μm. (C) Representative images of rat skin are shown immediately or 1 day after application of an effervescent MN patch in vivo. Yellow arrows indicate the MN patch application site. Scale bar, 1 cm. (D) Rat plasma concentrations of LNG after administration of LNG-loaded effervescent MN patches. The therapeutic LNG level in humans is indicated by the blue dashed line. Each point represents mean ± SD (n = 10). (E) Cumulative LNG absorbed in vivo after administration of LNG-loaded effervescent MN patches as a function of time as determined by pharmacokinetic modeling of the data shown in (D). Each point represents mean ± SD (n = 10). Photo credit: Wei Li, Georgia Tech.