
Fig. 6. Application of effervescent MN patches to human participants.
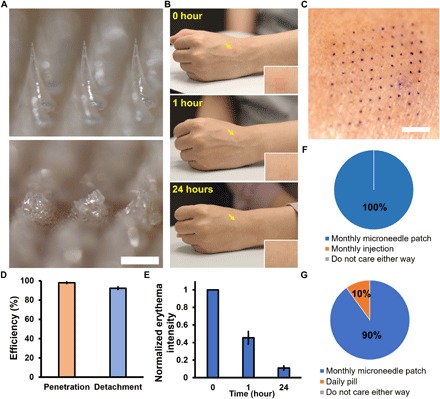
(A) Representative bright-field microscopy images of a section of an effervescent MN patch before (top) and after (bottom) application to human skin. Scale bar, 500 μm. (B) Representative images of the site of effervescent MN patch application (yellow arrows) to the skin of a human participant over time. Inset shows magnified images of the skin application site. These images are all from the same participant. (C) Representative photographic image of skin on a human participant stained to show where a 10 × 10 array of MNs punctured into skin. Scale bar, 2 mm. (D) The efficiency of penetration and detachment of effervescent MN patches in skin of human participants. Each point represents mean ± SD (n = 3). (E) Normalized erythema intensity of human skin over time at the site of effervescent MN patch application. Each point represents mean ± SD (n = 10). (F) Preference of human participants for monthly application of effervescent MN patch compared to monthly hypodermic injection for delivery of contraceptive (n = 10). (G) Preference of human participants for monthly application of effervescent MN patch compared to daily oral administration by pill for delivery of contraceptive (n = 10). Photo credit: Wei Li, Georgia Tech.