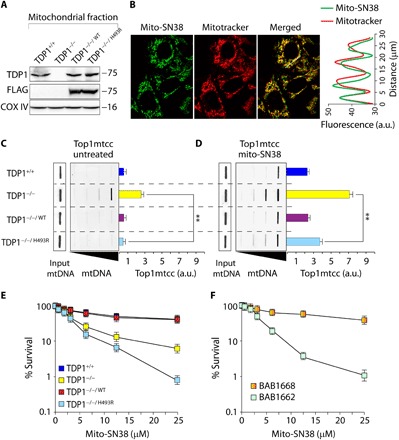
Fig. 1. Mito-SN38 containing nanoparticle poisons Top1mt (Top1mtcc).

(A) Western blot analysis of mitochondrial lysates extracted from the indicated MEFs. TDP1−/−/WT and TDP1−/−/H493R: TDP1−/− complemented with exogenous FLAG-tagged human wild-type or SCAN1 mutant (H493R) TDP1, respectively. Blots were probed with anti-TDP1, anti-FLAG, and anti–COX IV antibodies. COX IV served as a positive mitochondrial marker. (B) Representative confocal images showing accumulation of mitochondria-targeted cationic nanoparticle containing Top1 poison irinotecan (mito-SN38; intrinsic green fluorescence) inside the mitochondria (labeled with MitoTracker red). MEFs were incubated with mito-SN38 (5 μM for 20 min), and the fluorescence patterns were recorded under live-cell microscopy. Colocalization is shown in the merged image. Quantitation of the pixel intensity of fluorescence along the indicated white line in the merged image (right). The white line was drawn arbitrarily along the region of interest (ROI). a.u., arbitrary units. (C and D) Poisoning of Top1mt (Top1mtcc) in the indicated MEFs expressing TDP1 variants; either untreated (C) or treated with mito-SN38 (5 μM for 3 hours) (D). Top1mtcc was detected by ICE (immunocomplex of enzyme) bioassay. MtDNA at increasing concentrations (0.5, 1, 2, and 4 μg) was immunoblotted with an anti-Top1mt–specific antibody. The mtDNA input was probed with anti-dsDNA (double-stranded DNA) antibody. Densitometry analysis of trapped Top1mtcc band intensity was quantified and expressed as fold increase relative to mtDNA input (error bars represent means ± SEM). Asterisks denote statistically significant differences (**P < 0.01, t test). (E and F) Cell survival curves of indicated MEF variants (E) and a SCAN1 patient–derived lymphoblastoid cell line (BAB1662) and its wild-type counterpart (BAB1668) (F). Mito-SN38–induced cytotoxicity (%) was calculated with respect to the untreated control. Each point corresponds to the mean ± SD of at least three experiments. Error bars represent SDs (n = 3).
