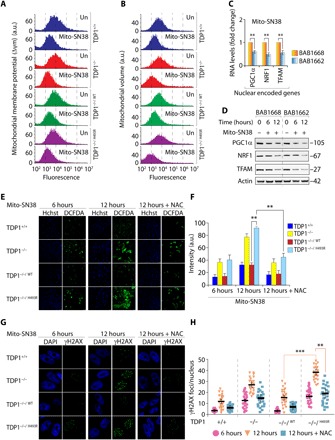
Fig. 4. TDP1H493R trapping promotes mitochondrial dysfunction in SCAN1 cells.

(A) Fluorescence-activated cell sorting (FACS) analysis of mitochondrial membrane potential (Δψm) using TMRM before or after treatment with mito-SN38 (5 μM for 6 hours) in the indicated cells. TMRM fluorescence was plotted against cell numbers (count). Data represent means ± SE of independent experiments. (B) FACS analysis of mitochondrial volume in the indicated cells using MitoTracker green before and after treatment with mito-SN38 (5 μM for 6 hours). Data represent means ± SE of independent experiments. (C) The gene expression profile of nuclear-encoded genes [nuclear respiratory factor 1 (NRF1), peroxisome proliferator-activated receptor gamma coactivator 1-α (PGC1α), and mitochondrial transcription factor A (TFAM)] for mitochondrial biogenesis by reverse transcription PCR. Indicated cells were either not treated or treated with mito-SN38 (5 μM for 6 hours). Data represent means ± SE of three independent experiments. Asterisks denote statistically significant differences (**P < 0.01, t test). (D) Representative Western blots for nuclear-encoded NRF1, PGC1α, and TFAM in SCAN1 patient–derived lymphoblastoid cell lines (BAB1662) and their wild-type counterpart (BAB1668) before and after treatment with mito-SN38 (5 μM) for the indicated time periods. Actin is shown as the loading control. (E and F) ROS formation was measured by fluorescent dye CM-H2DCFDA in live-cell microscopy after treatment with mito-SN38 (5 μM) or with pretreatment of N-acetyl-l-cysteine (NAC) (10 mM for 2 hours) for the indicated time. The ROS intensity is shown in green, and nuclei were stained with Hoechst 33342 (blue) in the indicated cells. Plots shown on the right represent means ± SDs of at least three experiments. Asterisks denote statistically significant difference (**P < 0.01, t test). (G and H) Representative γH2AX visualization by immunofluorescence microscopy in MEFs expressing TDP1 variants after treatment with mito-SN38 (5 μM) or with pretreatment of NAC (10 mM for 2 hours) for the indicated time. The γH2AX is shown in green, and nuclei were stained with 4′,6-diamidino-2-phenylindole (DAPI) (blue). Scattergrams are shown on the right for at least three experiments; means ± SDs are indicated. Asterisks denote statistically significant differences (**P < 0.01 and ***P < 0.001, t test).
