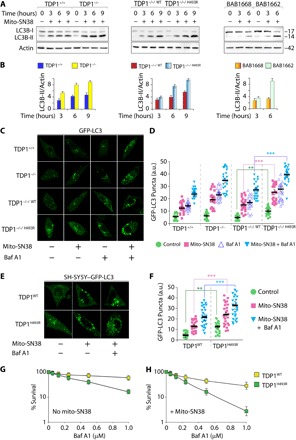
Fig. 5. SCAN1-TDP1 in mitochondria activates autophagy.

(A) Immunoblotting for LC3-II lipidation with an anti-LC3B–specific antibody with the indicated cell lysates before or after treatment with a sublethal dose of mito-SN38 (2.5 μM) for the indicated time periods. The positions of LC3B-I and LC3B-II are indicated. Actin is shown as the loading control. (B) Plots represent fold increase in LC3B-II band intensity in the indicated cells, normalized to actin (error bars represent means ± SEM). (C) Representative images of GFP-LC3 puncta formation using live-cell confocal microscopy in the indicated cells by ectopically expressing GFP-LC3. The cells were either untreated or treated with mito-SN38 (2.5 μM for 12 hours) or the autophagy inhibitor Baf A1 (200 nM for 4 hours) alone or in combination with Baf A1 (200 nM for 4 hours) + mito-SN38 (2.5 μM for 12 hours). The translocation of GFP-LC3 to phagosome triggers steady-state levels of autophagosomes, as indicated by GFP-LC3 puncta formation. (D) Quantification of GFP-LC3 puncta per cell after the indicated treatment obtained from immunofluorescence confocal microscopy was calculated for 20 to 25 cells (mean ± SEM) from independent experiments. Asterisks denote statistically significant differences (**P < 0.01 and ***P < 0.001, t test). (E) Representative images of differentiated neuronal cells derived from human neuroblastoma cells (SH-SY5Y) stably expressing GFP-LC3 were transfected with lentiviral constructs of TDP1WT or TDP1H493R and were analyzed for GFP-LC3 puncta formation under live-cell confocal microscopy. The cells were either kept untreated or treated with mito-SN38 (2.5 μM for 12 hours) or the autophagy inhibitor Baf A1 (200 nM for 4 hours) alone or in combination with Baf A1 (200 nM for 4 hours) + mito-SN38 (2.5 μM for 12 hours). (F) Quantification of GFP-LC3 puncta per cell after the indicated treatments was obtained from live-cell microscopy calculated for 20 to 25 cells (mean ± SEM) from independent experiments. Asterisks denote statistically significant differences (**P < 0.01 and ***P < 0.001, t test). (G and H) Cell survival of differentiated neuronal cells from SH-SY5Y cells expressing TDP1WT or TDP1H493R. Baf A1–induced cytotoxicity (%) was calculated with respect to the untreated control (G). Combination of mito-SN38 (2.5 μM for 12 hours) + Baf A1 (for the next 24 hours)–induced cytotoxicity (%) was calculated with respect to the untreated control (H). Each point corresponds to the mean ± SD of at least three experiments. Error bars represent SD (n = 3).
