
Fig. 6. TDP1H493R trapping in mitochondria activates mitophagy.
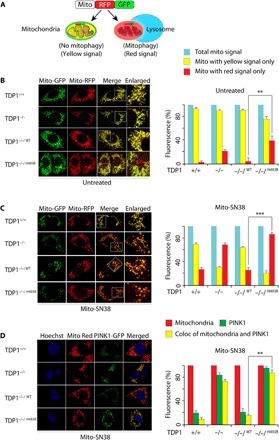
(A) Schematic representation for mitophagy monitoring using the dual fluorescence reporter construct p–mito-mRFP-EGFP (pAT016). Lysosomal delivery of the tandem fusion protein mito-mRFP-EGFP along with entire mitochondria results in pH-dependent quenching of green fluorescence resulting in red-only fluorescence for visual analysis of mitophagic flux. (B and C) Representative confocal live images of indicated MEFs ectopically expressing mito-mRFP-EGFP targeting mitochondria. Cells were kept untreated (B) or treated with mito-SN38 (2.5 μM for 12 hours) (C) and were analyzed under live-cell microscopy. The yellow fluorescence signals denote no mitophagy (merged image); red-only fluorescence signals denote mitophagy or mitochondria inside lysosomes. The enlarged panel shows higher-magnification image. Quantification of the indicated fluorescence obtained from live-cell confocal microscopy was calculated for 20 to 25 cells (calculated value ± SEM) in at least three independent experiments. Asterisks denote statistically significant differences (**P < 0.01 and ***P < 0.001, t test). (D) Representative confocal images of live cells for the indicated MEFs showing accumulation of ectopic PTEN-induced kinase 1 (PINK1)–GFP after mito-SN38 (2.5 μM for 3 hours) treatment. Mitochondria are labeled with MitoTracker red; the colocalization of PINK1-GFP (green) in the mitochondrial network (red) is indicated in the merged image. Quantification of the indicated fluorescence obtained from live-cell confocal microscopy was calculated for 20 to 25 cells (calculated value ± SEM) obtained from independent experiments. Asterisks denote statistically significant differences (**P < 0.01, t test).