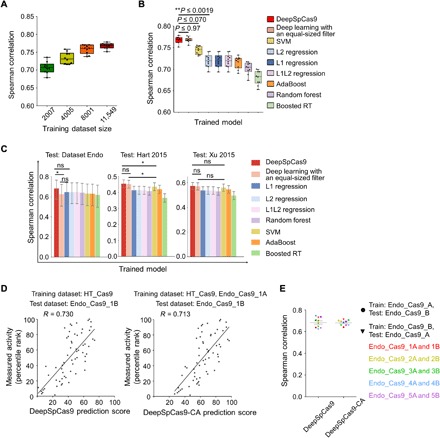
Fig. 2. Evaluation of machine learning–based computational models predicting Cas9 activities.

(A) Cross-validation of DeepSpCas9 models trained on datasets of varying sizes. Each dot represents the Spearman correlation coefficient between the measured indel frequency and the predicted activity from 10-fold cross-validation (total n = 10 correlation coefficients). (B) Cross-validation of SpCas9 activity prediction models based on previously reported machine learning–based approaches. Each dot represents the Spearman correlation coefficient between the measured indel frequency and the predicted activity from 10-fold cross-validation (total n = 10 correlation coefficients). Statistical significances between the best, next-best, and third-best models are shown (Steiger’s test). In (A) and (B), the top, middle, and bottom lines in the boxes represent the 25th, 50th, and 75th percentiles, respectively. Whiskers indicate the minimum and maximum values. The confidence intervals are described in table S6. RT, regression trees. (C) Performance comparison of DeepSpCas9 with other prediction models using dataset Endo_Cas9 (n = 124 independent target sites) and two published datasets (n = 4207 and 2060 independent target sites for datasets Hart 2015 and Xu 2015, respectively) as the test datasets. Error bars represent 95% confidence intervals, which are described in detail in table S6. For clarity, results from statistical testing are shown only for DeepSpCas9 versus deep learning with an equal-sized filter, DeepSpCas9 versus the best conventional machine learning–based model, and deep learning with an equal-sized filter versus the best conventional machine learning–based model (left to right: *P = 1.4 × 10⁻², DeepSpCas9 versus deep learning with an equal-sized filter; *P = 1.1 × 10⁻², DeepSpCas9 versus SVM; *P = 4.6 × 10⁻², deep learning with an equal-sized filter versus SVM; Steiger’s test). ns, not significant. (D) Performance comparison of DeepSpCas9 and DeepSpCas9-CA (chromatin accessibility). The DeepSpCas9-CA model was developed by fine-tuning the DeepSpCas9 model using the Endo-1A dataset. DeepSpCas9 (left) and DeepSpCas9-CA (right) models were evaluated with the Endo-1B dataset. The Spearman correlation coefficients (R) are shown. (E) Results from 10 iterations of fine-tuning and evaluation. Each dot represents the Spearman correlation coefficient between the measured indel frequency and the predicted activity. A total of 10 (= 2 × 5) rounds of fine-tuning and subsequent testing results are shown.
