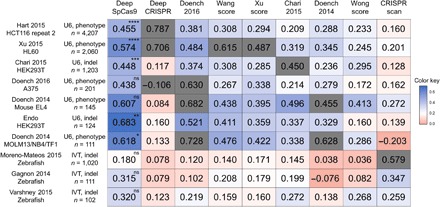
Fig. 3. Comparison of generalization performances of computational models predicting Cas9 activities.

The heat map shows Spearman correlation coefficients determined from DeepSpCas9 and previously reported models, which are arranged horizontally. The names of the vertically placed test datasets include information about the cell line or species used. Other related parameters, such as the guide RNA expression method [U6 promoter–driven (U6) versus in vitro transcribed (IVT)], the Cas9 activity analysis method [phenotypic change (phenotype) versus indel], and the number of analyzed sites, are also shown. Each gray box indicates the correlation of a model tested against a test dataset that includes its own training dataset. In the evaluation against each test dataset, the statistical significance between the two best models is indicated for the best model (from the top: ****P = 5.3 × 10⁻⁹, ****P = 1.8 × 10⁻¹⁰, ****P = 3.4 × 10⁻⁸, ****P = 1.1 × 10⁻¹³, ****P = 2.9 × 10⁻¹¹, ****P = 3.9 × 10⁻⁸, ***P = 2.5 × 10⁻⁴, *P = 3.7 × 10⁻², and *P = 3.9 × 10⁻²; Steiger’s test).
