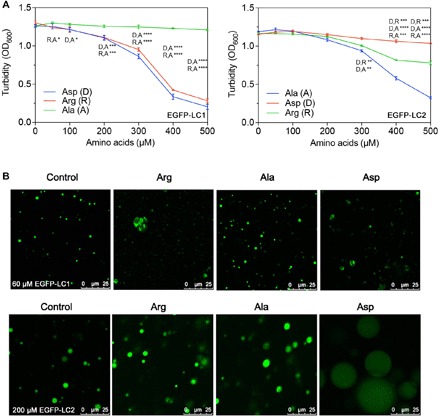
Fig. 3. LLPS of LC1 and LC2 with Arg, Ala, or Asp doped.

(A) Turbidity changes with increasing concentrations of free amino doped into LC1 (60 μM) or LC2 (200 μM). (B) Droplet morphology of LC1 or LC2 changes with the free amino acids. Multiple t tests, n = 3; *P < 0.1234, **P < 0.0332, ***P < 0.0021, and ****P < 0.0001.
