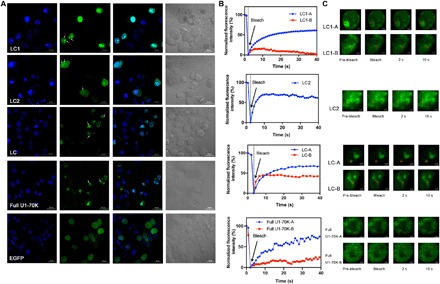
Fig. 5. LLPS and aggregation of U1-70K and the LC fragments in cells.

(A) Confocal microscopy of EGFP-LC1, EGFP-LC2, EGFP-LC, and full-length U1-70K in N2a cells. Nucleus was stained with 4′,6-diamidino-2-phenylindole (DAPI) in blue. EGFP alone was expressed as control. Arrows showed droplet-like entities in cells. (B) FRAP results of EGFP- LC1, EGFP-LC2, EGFP-LC, and full-length U1-70K in N2a cells. The fluorescence intensities of each area marked by red circles in (C) were plotted versus time. The intensity was normalized with the pre-bleached as 100% and first time point after bleach as 0%. (C) Fluorescence images during FRAP.
