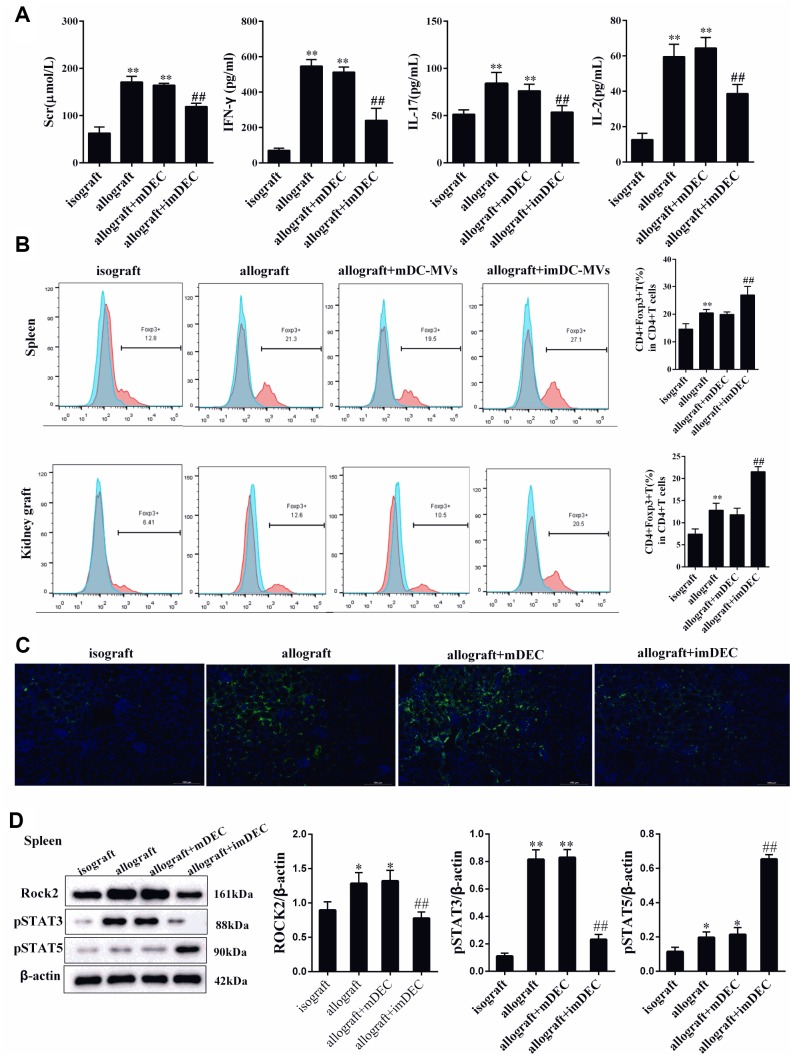
Figure 2.
imDEC reduced the production of cytokines. (A) Renal function indicator Scr, and rejection associated cytokines IFN-γ, IL-2, IL-17 levels in plasma were detected in isograft group, allograft group, allograft+mDEC group, and allograft+imDEC group. (B) The percentage of Foxp3+CD4+T cells in spleen and kidney tissues was detected in isograft group, allograft group, allograft+mDEC group, and allograft+imDEC group. (C) Immunofluorescence images show the expression of ROCK2 in isograft group, allograft group, allograft+mDEC group, and allograft+imDEC group. (D) The expression of ROCK2, p-STAT3 and p-STAT5 were measured in CD4+T cells from spleen of isograft group, allograft group, allograft+mDEC group, and allograft+imDEC group. **P<0.01 vs isograft group; ##P<0.01 vs allograft+mDEC group.

