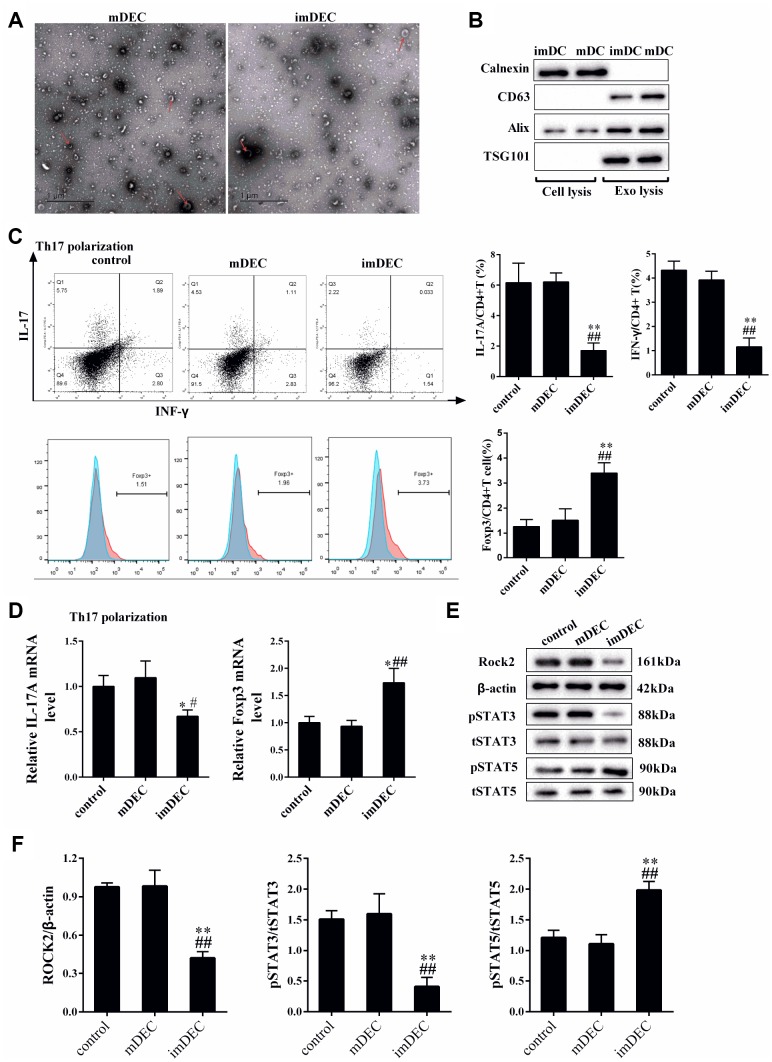
Figure 3.
imDEC suppressed the IL17+CD4+T cells and promoted the Foxp3+CD4+T cells. (A) imDECs and mDECs from imDCs and mDCs were determined by transmission electron microscope (TEM). (B) Western blot showed the Calnexin, exosome markers CD63, Alix and TSG10 expressions in cell lysis and exo lysis of imDCs and mDCs. (C) Primary CD4+T cells were collected from the spleen. Under Th17 polarization condition, the percentage of IL17+CD4+T cells and IFN-γ+CD4+T cells were detected in control, mDEC and imDEC groups. (D) The mRNA transcription of Foxp3 and mRNA transcription of IL-17A were detected in control, mDEC and imDEC groups under Th17 polarization condition for 72 h. (E–F) The expressions of p-STAT5, p-STAT3 and ROCK2 were detected in control, mDEC and imDEC groups. *P<0.05 vs control; **P<0.01 vs control; #P<0.05 vs mDEC; ##P<0.01 vs mDEC.

