
Figure 4.
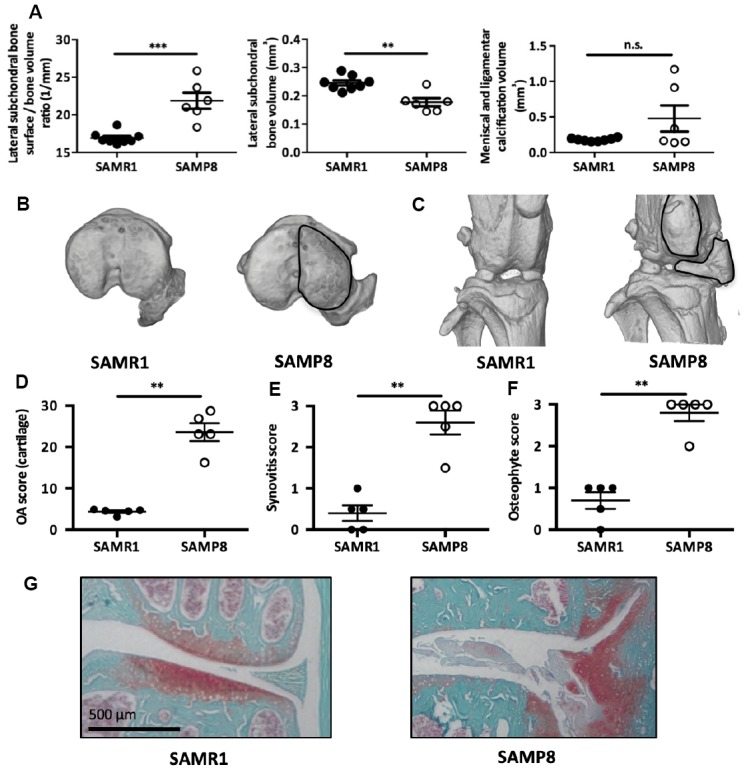
SAMP8 mice display a spontaneous OA phenotype. (A) Histo-morphometric analysis by micro-CT of the left knee in SAMR1 and SAMP8 mice. Graphs represent the mean ± SEM (n=8 for SAMR1, n=5 for SAMP8); **=p<0.01, ***=p<0.001. (B) Representative micro-CT images showing higher sub-chondral bone modification and (C) ligament calcifications in SAMP8 mice compared with SAMR1 mice. Knees from SAMR1 and SAMP8 mice were stained with Safranin-O/Fast Green to quantify: (D) spontaneous cartilage degradation (OA modified score according to van den Berg, from 0 to 30), (E) spontaneous synovial membrane inflammation (synovitis semi-quantitative score, from 0 to 3), and (F) osteophytes (osteophyte semi-quantitative score, from 0 to 3). Data are the mean ± SEM (n=5 for each condition). **=p<0.01. (G) Representative images of the spontaneous OA phenotype in SAMP8 mice with cartilage degradation compared with SAMR1 mice.