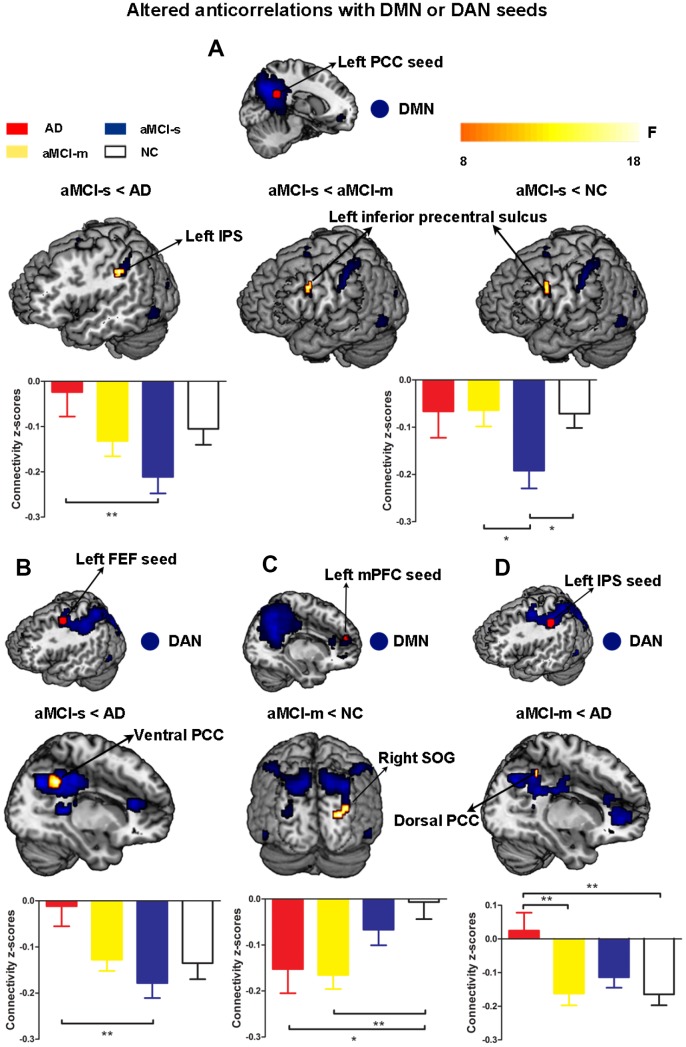
Figure 4.
Altered anticorrelations between the DMN and DAN among the four groups. (A) Regions showing altered anticorrelations with the left PCC seed among the four groups; (B) Regions showing altered anticorrelations with the left FEF seed between the aMCI-s and AD groups; (C) Regions showing altered anticorrelations with the left mPFC seed between the aMCI-m and NC groups; (D) Regions showing altered anticorrelations with the left IPS seed between the aMCI-m and AD groups. Significant regions (shown in warm yellows) were overlaid on the main effect maps (shown in blue) which were corrected using a voxel threshold of FWE correction (P < 0.05). Bar graphs displayed mean rsFC z scores for the AD, aMCI-s, aMCI-m and NC groups and the error bars represented standard deviation. Mean rsFC z scores were analyzed with SPSS 20 using one-way ANOVA. *p < 0.05. **p < 0.01. Abbreviations: DMN: default mode network; DAN: dorsal attention network; PCC: posterior cingulate cortex; IPS: intraparietal sulcus; FEF: frontal eye fields; mPFC: medial prefrontal cortex; SOG: superior occipital gyrus; AD: Alzheimer's disease; aMCI-s: single-domain of amnestic mild cognitive impairment; aMCI-m: multiple-domain of amnestic mild cognitive impairment; NC: normal controls.

