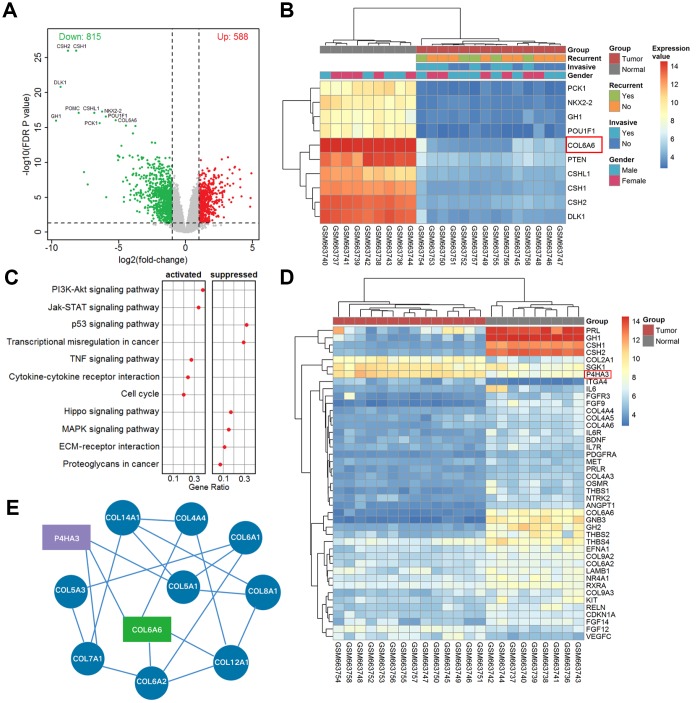
Figure 1.
The differentially expressed mRNAs and pathway in PA. (A) Volcano plot of differentially expressed genes in the whole cohort vs. normal. The red dots represent up-regulated genes and the green dots represent down-regulated genes; (B) Heatmap of top ten differentially expressed genes in tumor vs. normal; (C) The dotplot of significantly altered pathways in PA tissues analyzed by GSEA; (D) The heat map of differentially expressed mRNAs in the PI3K-Akt pathway analyzed from microarray GSE26966; (E) The correlative network of COL6A6 and differentially expressed mRNAs involved in the PI3K-Akt signaling pathway in PA.

