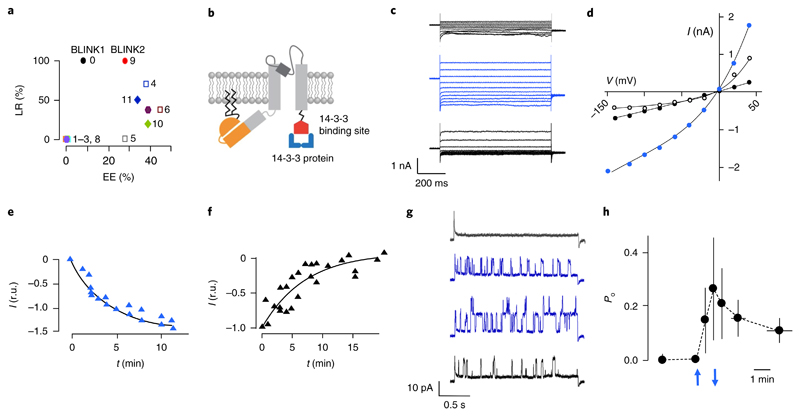
Fig. 1. Engineering and characterization of BLINK2.
a, Surface expression and light regulation of BLINK1 derivatives. Expression efficiency (EE) was defined as the percentage of cells with measurable BLINK1-like current. Light regulation (LR) represents the percentage of cells that did not show dark current. Clones are numbered according to Supplementary Table 1. b, Cartoon representation of BLINK2 showing the KcvPBCV1channel (gray), LOV2 domain (orange), N-terminal myristoylation and palmitoylation sites (zigzagging black lines) and a fragment of Arabidopsis thaliana KAT1 protein (GenBank AED95356.1) (red) for binding of 14-3-3 proteins (blue). c, Whole-cell recordings from a COS7 cell transfected with BLINK2 in response to voltage steps from +60 to –140 mV in the dark (top black traces), 5 min after the start of blue light illumination (blue traces) and 5 min after returning to darkness (bottom black traces). Similar results were obtained in n=9 cells from 10 independent experiments. d, I/V relationship from measurements in c in the dark (black solid circles), in blue light (blue circles) and after a return to dark conditions (open black circles). e,f, Activation kinetics of BLINK2 current in blue light (e) and after deactivation in the dark (f). Currents were recorded at –100 mV and normalized to t = 5 and t = 0 min for activation and deactivation, respectively (r.u., relative units). Data were fitted with a single exponential (solid line). g, Single-channel recordings from cell-attached measurement of BLINK2 in COS7 cells. The traces show the current response to a voltage step from 0 mV to+40 mV in a dark-adapted cell (top black trace), after 1.5 and 2 min of blue light (blue traces) and 1 min after turning the light off (bottom black trace). Similar results were obtained in n=4 cells from 4 independent experiments. h, Open probability (Po) changes of BLINK2 single channels in response to dark/light transitions. Recordings were done at + 40mV in the cell-attached configuration. Blue arrows indicate the time of light on (upward-facing arrow) and light off (downward-facing arrow). Data shown are the mean ± s.d. of the time at which measurements were performed in 4 experiments. In all experiments reported in this figure, the blue light (455 nm) intensity was 90 μW/mm2.

