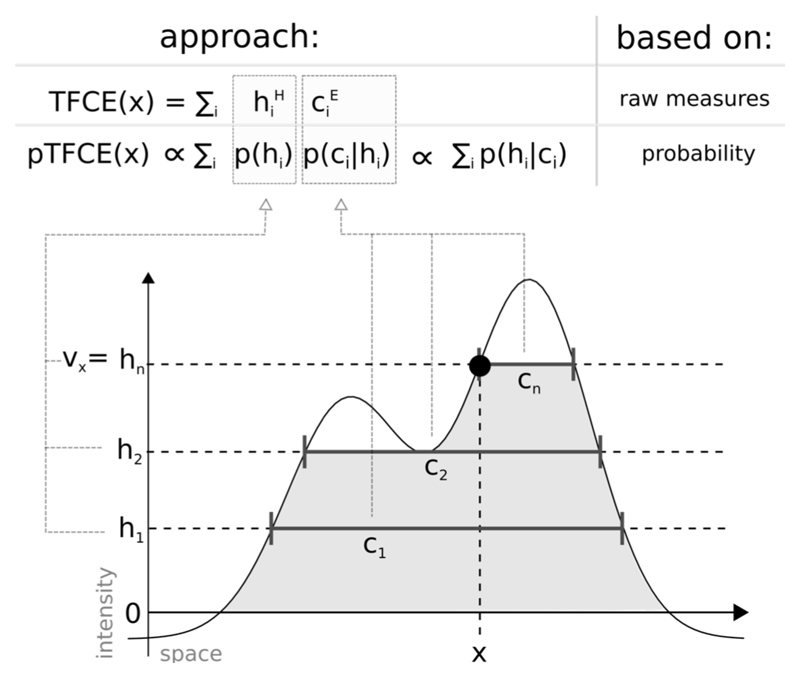
Figure 1. Illustration of the relation between the TFCE and the pTFCE approach.
Both approaches are based on the integration of cluster-forming height threshold (h1, h2, …, hn) and the supporting section or cluster size (c1, c2, …, cn) at that given height. The difference is that, while TFCE combines raw measures of height and cluster size to an arbitrary unit, pTFCE realises the integration by constructing the conditional probability p(h|c) based on Bayes’ rule, thereby providing a natural adjustment for various signal topologies. Aggregating this probability across height thresholds provides enhanced P-values directly, without the need of permutation testing.

