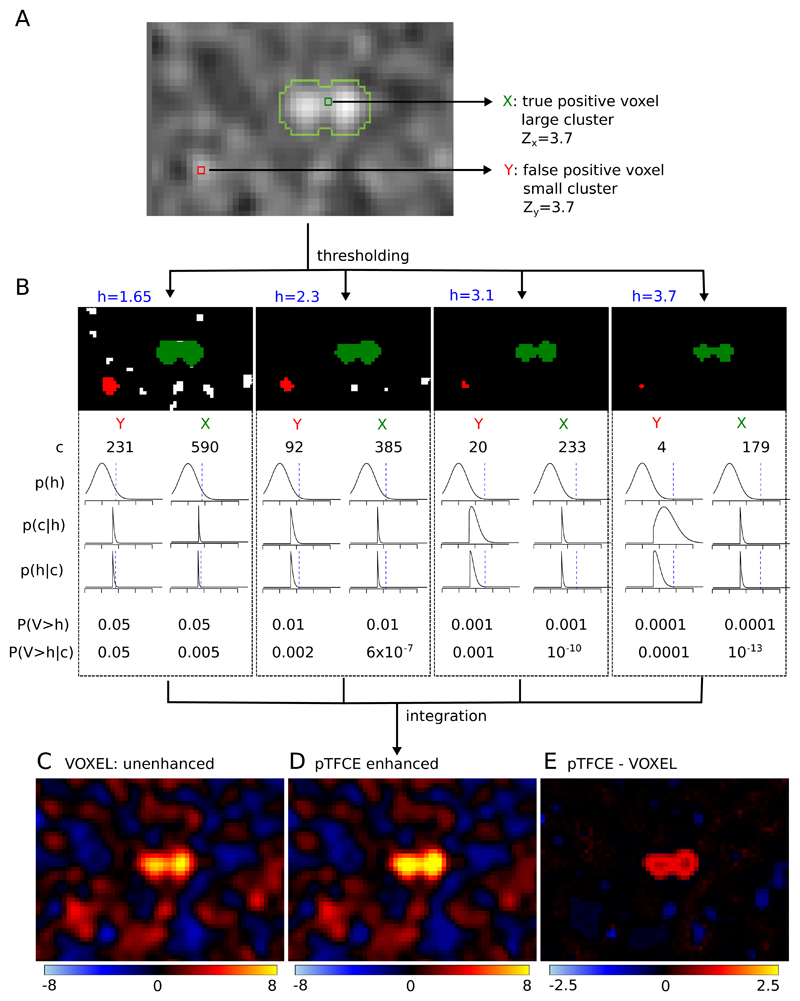
Figure 2. The “internal workings” of the pTFCE approach in a simulation case.
Two voxels in a simulated image (signal 01 with SNR=1 and smoothing FWHM=1.5, see Evaluation Methods) with equal Z-score were chosen. One of them is part of a true signal artificially added to the smoothed noise image (denoted as X and with green colour), the other is random noise (Y, red). In part (A), the location of the selected voxels on the image is shown and the true positive areas are outlined with light green contour. Part (B) shows thresholded versions of the image (thresholds: h=1.65, 2.3, 3.1, 3.7, thresholds denoted by blue colour). The green and red clusters belong to voxels X and Y, respectively. For both clusters, the size of the cluster (c), the PDF of p(h) and the likelihood p(c|h) are plotted against Z-score thresholds on a range of [-2, 6]. Multiplying these and dividing by a normalizing constant gives the posterior p(h|c). Unenhanced (P(V>h)) and pTFCE-enhanced (P(V>h|c)) P-values are calculated for both voxels at each cluster forming threshold. While enhanced P-values are only slightly different from the original unenhanced P-values for the random noise voxel Y, they exhibit a remarkable difference in the case of the true positive voxel X. In the pTFCE approach, these probabilities belonging to various thresholds are aggregated by an equidistant incremental logarithmic probability pooling approach (See section “Probability aggregation across thresholds” and Figure 3 for a geometric representation). Subtracting the unenhanced image (C) from the pTFCE enhanced image (D) reveals a remarkable intensity enhancement in the area of true signal.

