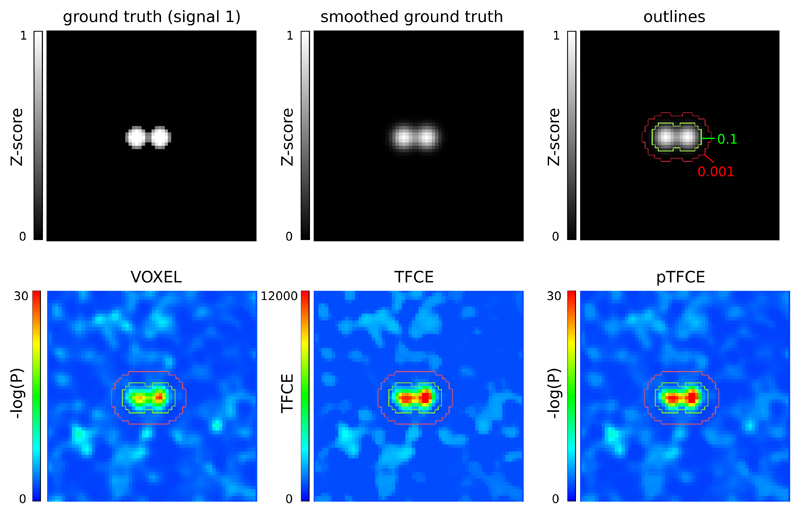
Figure 4. Representative images of the simulation and ROC ROIs for the investigated approaches.
In the upper row, the unsmoothed and the smoothed (FWHM=1.5) versions of signal 2, and the outlines corresponding to the ROC (inside vs. outside the 0.1 contour), AFROC (inside the 0.1 contour) and negative AFROC (outside the 0.001 contour) analysis. In the lower row, results of the VOXEL, TFCE and pTFCE methods with the same noise realisation (noise 0001) are visualized with the contours as overlay.

