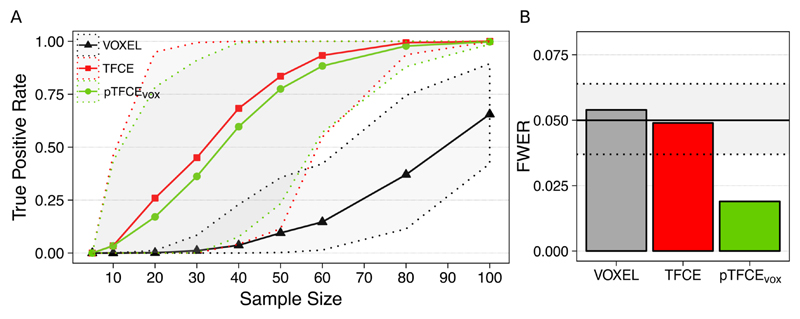
Figure 7. Performance of pTFCE on the “taskswitch” paradigm of the NCP dataset (Gorgolewski et al., 2017; Poldrack et al., 2016).
(A) Counting the voxels of the full-sample (N=119) group-level FWER-corrected, unenhanced activation map also found by the investigated methods in various subsamples and plotting the mean (solid lines) and the 95% confidence intervals (dotted lines) as a function of sample sizes provides an estimate of the improvement in statistical power. (B) Family-wise error rates (FWER) of the investigated methods. Methods VOXEL and TFCE were thresholded using permutation test while pTFCE was thresholded at the same threshold as VOXEL, resulting in the pTFCEvox approach. Dotted lines denote the 95% confidence interval for FWER for the 1000 repetitions.

