Figure 1.

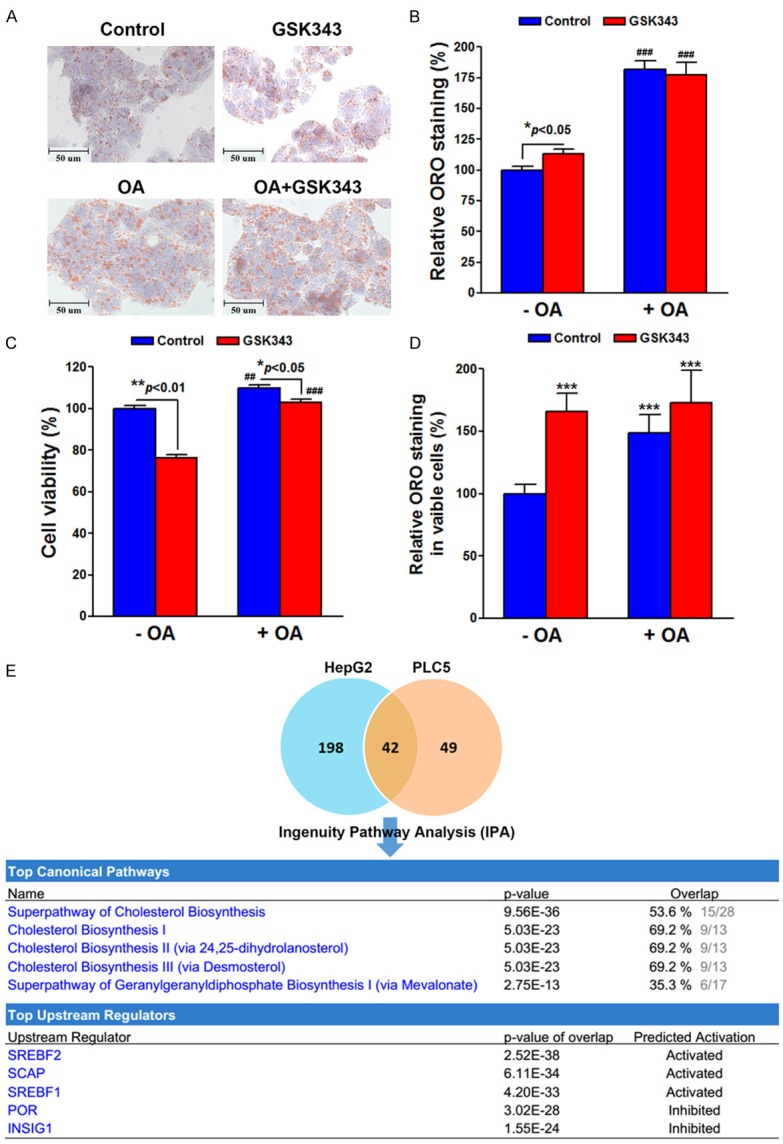
Effect of GSK343 on lipid accumulation and related pathways. HepG2 cells were treated with 20 μM GSK343 for 6 h in the presence or absence of 0.25 mM oleic acid (OA). The lipid content was measured by Oil Red O staining assay. Cells were imaged by inverted microscope (A). The lipid content was quantified by extracting the stain with 100% isopropanol. The absorbance at 492 nm was measured (B). A parallel cell viability (C) was performed for the normalization of lipid content by viable cell numbers (D). In (B), P < 0.001 (###) indicates significant differences between OA-treated and untreated cells. In (C), P < 0.01 (##) and P < 0.001 (###) indicates significant differences between OA-treated and untreated cells. In (D), P < 0.001 (***) indicates significant differences between GSK343/OA-treated and untreated cells. (E) HepG2 and PLC5 cells were treated with 10 μM GSK343 for 16 h and the gene expression profiles were analyzed by microarray. The overlapped genes (Table 2) were analyzed by IPA for the enrichment of canonical pathways and upstream regulators. The genes for the enrichment were shown in Tables 3 and 4, respectively.
