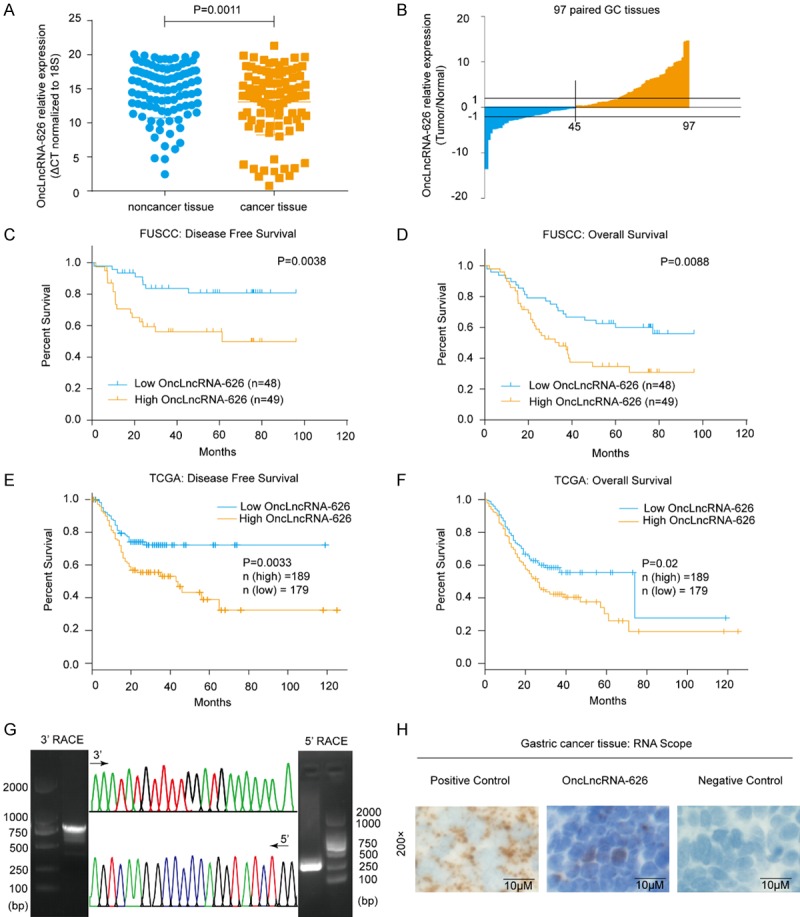
Figure 1.

A. OnclncRNA-626 expression levels were quantified in 97 pairs of GC tissues and adjacent normal tissues using qPCR. B. Fold-changes in onclncRNA-626 expression in GC tissues. C, D. Analysis of the correlation between onclncRNA-626 RNA levels and disease-free survival as well as overall survival in 97 GC patients. E, F. The disease-free survival and overall survival time in relation to onclncRNA-626 expression in the TCGA cohort (http://gepia.cancer-pku.cn). G. Representative images of PCR products from the 3’ RACE and 5’ RACE (left and right: images of agarose gel following electrophoresis; middle, sequencing of RACE products). H. RNAscope in situ hybridization images showing the distributions of onclncRNA-626 in GC tissues (left and right: images of positive and negative control; middle: images of onclncRNA-626). Bars: 10 μM.
