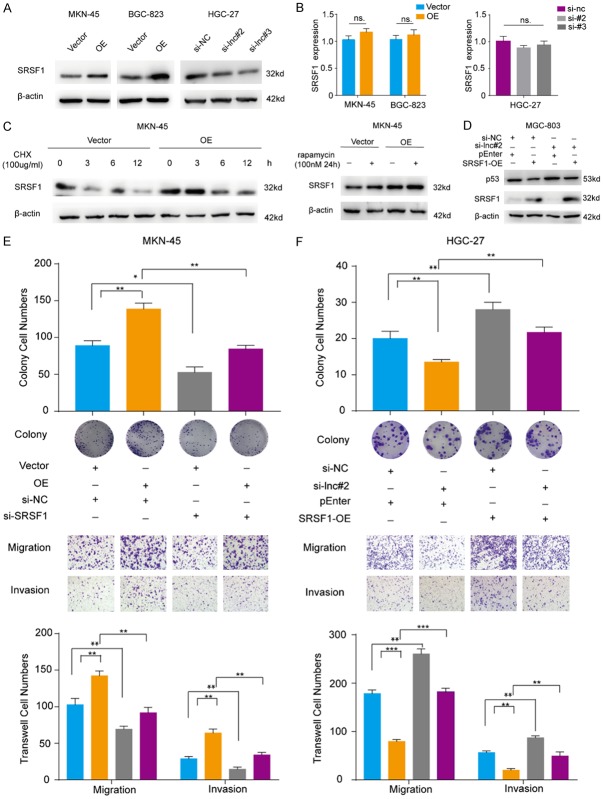
Figure 5.
(A) Immunoblotting for the protein levels of SRSF1 after overexpressing onclncRNA-626 in MKN-45 and BGC-823 cells or silencing its expression in HGC-27 cells. β-actin served as the internal control. (B) Quantification of SRSF1 mRNA levels by qPCR after overexpressing onclncRNA-626 in MKN-45 and BGC-823 cells or silencing onclncRNA-626 in HGC-27 cells. (C) MKN-45 cells overexpressing onclncRNA-626, while control cells were treated with cycloheximide (CHX, 100 μg/ml) for the indicated times or with rapamycin (100 nM) for 24 h. Immunoblotting for determining SRSF1 levels in whole-cell extracts. (D) Immunoblotting for the protein levels of p53 after overexpressing SRSF1 and silencing onclncRNA-626 in MGC-803 cell rescue assays. (E) Rescue assay analysis using transwell migration and invasion assays and colony formation assays after overexpressing onclncRNA-626 and silencing SRSF1 in MKN-45 cells. (F) Rescue assay analysis using transwell migration and invasion assays and colony formation assays after overexpressing SRSF1 and silencing onclncRNA-626 in HGC-27 cells. Data are shown as the mean ± SEM, n=3 in (B, E and F).

