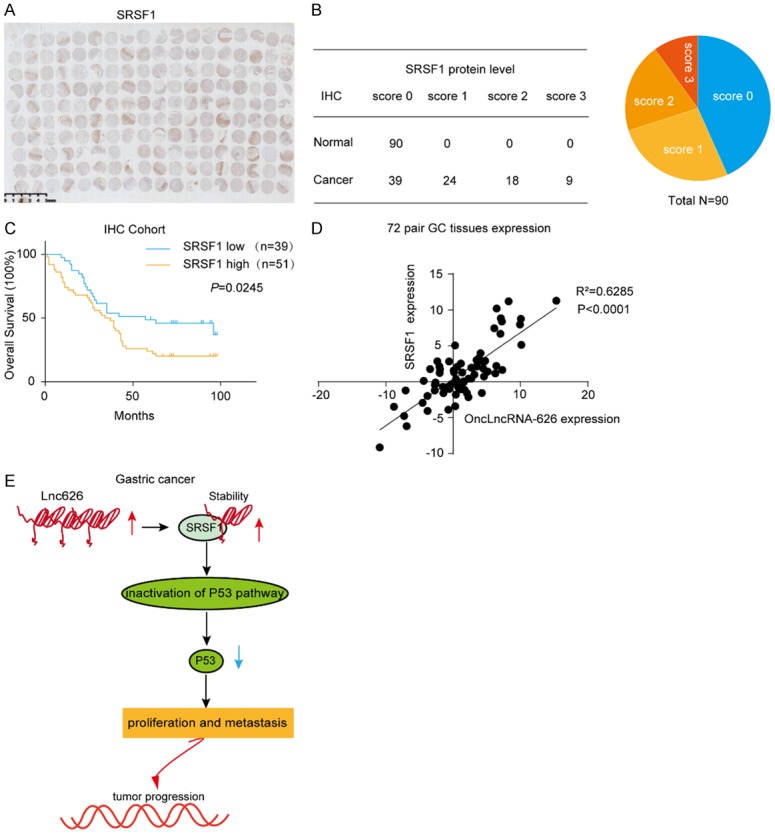
Figure 6.

A. IHC staining of the SRSF1 protein in a 90 paired gastric cancer tissue microarray. Scale bar: 5 mm. B, C. Expression levels and Kaplan-Meier analysis of the correlation between SRSF1 protein and overall survival in 90 GC patients. D. qPCR to determine the expression of SRSF1 and onclncRNA-626 in 72 pairs of GC tissues and adjacent normal tissues. E. Diagram of the biological mechanism of onclncRNA-626 in GC.
