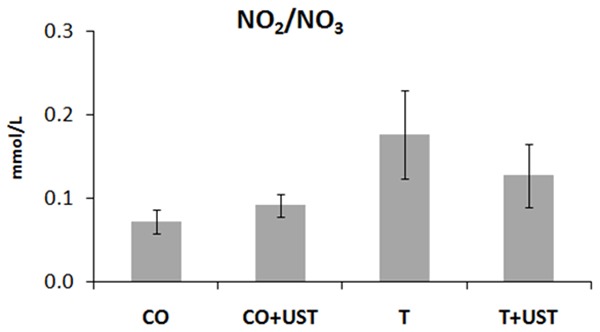
Figure 3.

Mean values of nitrite and nitrate levels (mmol/L) in the different experimental groups. Data are expressed as mean ± standard error. Legend: CO: control, CO + UST: control + therapeutic ultrasound, T: trauma, T + UST: trauma + therapeutic ultrasound. There was no significant difference between groups (P>0.05).
