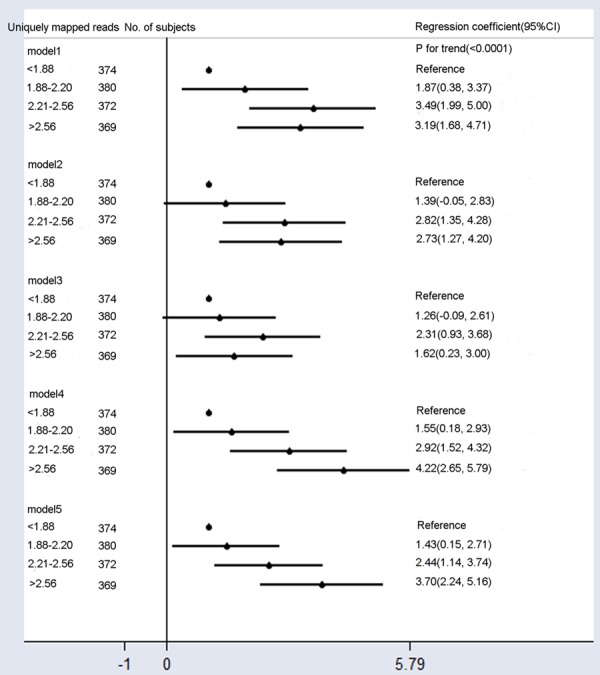
Figure 6.

Mean differences in fetal fraction according to uniquely mapped reads. Model 1: Crude model. Model 2 was adjusted for GA and BMI. Model 3 added the average cfDNA to Model 2. Model 4 added maternal age, multiple gestations, cfDNA concentration, and library concentration to Model 2. Model 5 added the average cfDNA size to Model 4. Compared to Models 2 and 4, Models 3 and 5 included additional adjustments for confounding factors of the average cfDNA szie, and they showed significantly reduced fetal fraction differences across uniquely mapped reads categories.
